Beyond The Headlines
PREPARING FOR THE SALE OF THE CENTURY — OR JUST BEING PRUDENT?
Stocks are trading too high. How did we get here? What are the two paths from here? How can we prepare and take advantage of what could prove to be the biggest sale ever?

Asset prices at record highs, and bound to decline
As much we avoid forecasting the market’s direction, we have reasons to believe the US stock market is too high. It’s not a question of “if” but “when,” “how much,” and “for how long” stock prices will drop. We believe that most asset prices could be subject to some of the biggest declines we have seen in decades, if not a century.
There are two possible paths from current highs. Both have been tried before, are well documented and well examined, and both lead downward. At Sicart Associates capital preservation is our foremost objective, so we need to pay close attention to this moment. While we are cautious near-term, and hold higher than usual cash levels, we are excited about the future buying opportunities that meaningful corrections always bring.
Stability begets instability
Twenty-five years ago, Professor Hyman Minsky (1919-1996) argued against the prevailing view that that economic crises were triggered by external stimuli such as oil crises, wars or technological revolutions. Minsky suggested that the internal dynamics of the system itself could generate shocks. (“The Financial Instability Hypothesis” – Levy Economics Institute of Bard College – May 1992)
In fact, Minsky believed that during periods of economic equilibrium, banks, investment firms and other economic agents become complacent. It is assumed that the good times will continue, so ever-greater risks are taken in pursuit of profit. In other words, the seeds of the next crisis are sown during the good times, in the form of increased financial leverage. Alas, Minsky’s theories were largely ignored outside of a small circle of like-minded experts until the 2007-2009 sub-prime mortgage crisis propelled him to near-rock-star status in the financial media.
Yet just weeks ago, on March 21st, 2017, one of history’s longest periods of low stock market volatility ended with the first daily 1% drop across all indices. This span of apparent stability, topping one of the longest bull markets in history, reminds us of famous economist Irving Fisher’s observation on the eve of the 1929 stock market Crash and Great Depression that “stock prices have reached what looks like a permanently high plateau.”
And, of course, it also points us to Hyman Minsky’s warning that “stability begets instability … the more stable things appear, the more dangerous the ultimate outcome will be, because people start to assume everything will be all right and end up doing stupid things.”
Planting seeds of instability, and shocks
We at Sicart believe that wealth preservation and growth for family fortunes holding a variety of assets is especially threatened by not only natural business cycles, but also by the excesses of irresponsible government policies around the world attempting to defy deflation.
As a country, the US finds itself at a point of record-high debt, excessively easy money policies, and inflated asset prices. We see only two paths from here, and neither offers great investment opportunities in the short term. One path opts for tightening fiscal and monetary policies sooner, and the other for doing so later (if at all). Eventually, both trajectories lead to major drops in asset prices.
Fortunes are saved at market peaks, and created at market lows
We are strong optimists about the future of the US and its economy, but we choose not to ignore major stock market swings that can hurt our clients.
Famous financiers Bernard Baruch and Baron Rothschild are credited with saying that the secret to their successes was selling too early. The biggest fortunes have been saved by stepping out of the markets in the midst of a bubble – not after it burst. We take note, and today hold historically high cash balances while we wait for the biggest buying opportunities ahead.
History also teaches us that the biggest fortunes were built not by picking the top of bull markets, but by being ready at the bottom of bear markets. That’s the period when we’ll be able to add the most value after saving our clients from the disappointments of a bursting bubble.
The three big questions
We’d like to propose answers to three key questions that are on our minds, and on the minds of those holding a variety of assets today.
- Why do we believe that prices are exceptionally high? How did we get here?
- Why do we believe they need to come down? What are the two possible paths for them to do so?
- How can we position ourselves now to take advantage of opportunities later on?
1. Why do we believe that prices are exceptionally high? How did we get here?
Today we are witnessing record stock prices, record valuations, record margins for companies, and slowing earnings growth — which without record-high stock repurchase programs funded with record-cheap debt, would be even slower. In other words, we are surrounded by inflated expectations waiting for a day of reckoning. That will be a severe reality check. Let us look at some charts to substantiate our claim.
The highest market, in the US and globally
As you can see on both charts, S&P 500 representing the US market is at an all-time high, and MSCI World covering the entire world is also breaking records.
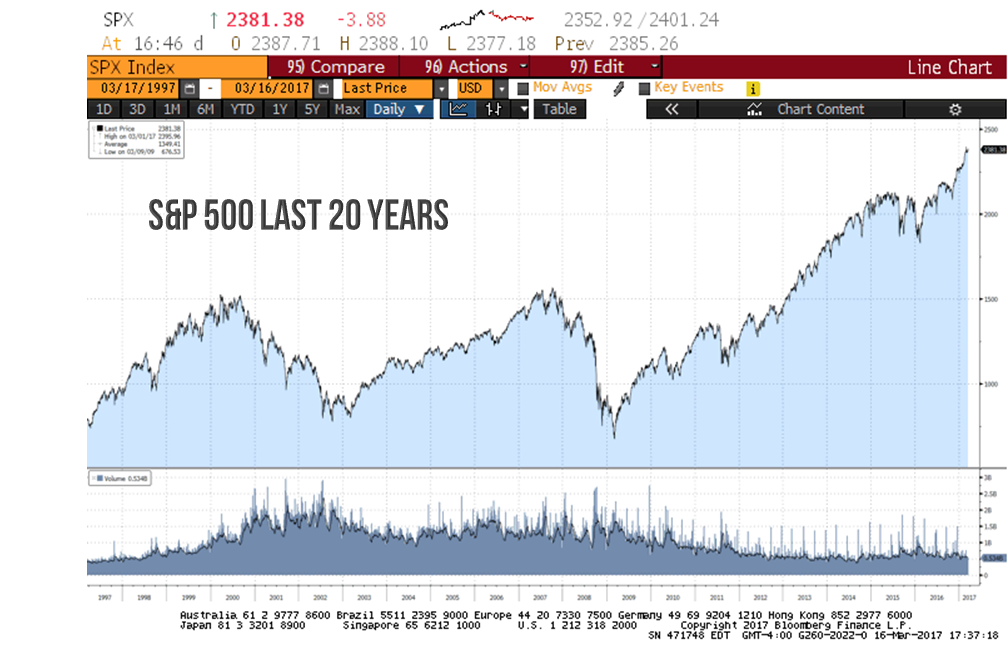
Source: Bloomberg.
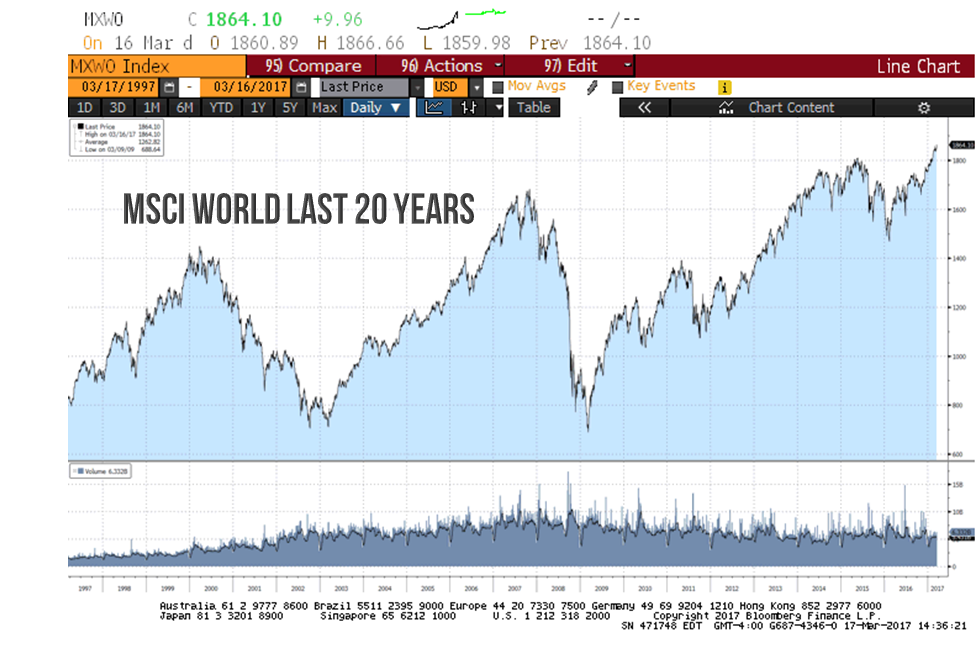
Source: Bloomberg.
Second-highest market valuation in 130 years, using CAPE
Professor Robert Shiller’s cyclically-adjusted price/earnings ratio tells a clear story that we have quoted in previous articles. The US stock market has been more expensive only in the midst of the internet bubble of the 1990s. In other words, today investors are paying 75% more for each dollar of companies’ earnings than we have on average over the last 130 years. See chart below.
Cyclically Adjusted Price to Earnings Ratio (CAPE) for the S&P 500
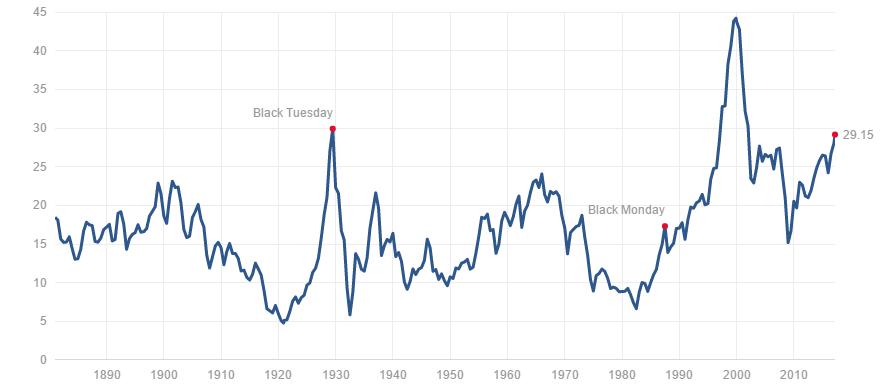
Source: Robert Shiller.
Actually, the highest-ever market valuations considering lackluster growth
Like any ratio, the CAPE doesn’t necessarily tell the whole story. Since the valuation of the market is an expression of growth expectations, it’s interesting to compare it with underlying economic growth. Here, we will see that the current CAPE divided by ten-year average growth of GDP is substantially higher than it was even during the internet bubble.
Meanwhile, as John P. Hussman of the Hussman Funds, points out in his 3/6/17 letter to Fund holders, the valuation of the median component of the S&P 500 (50% are cheaper and 50% more expensive) “is already far beyond the median valuations observed at the peaks of 2000, 2007 and prior market cycles… making this the most broadly overvalued moment in market history.”
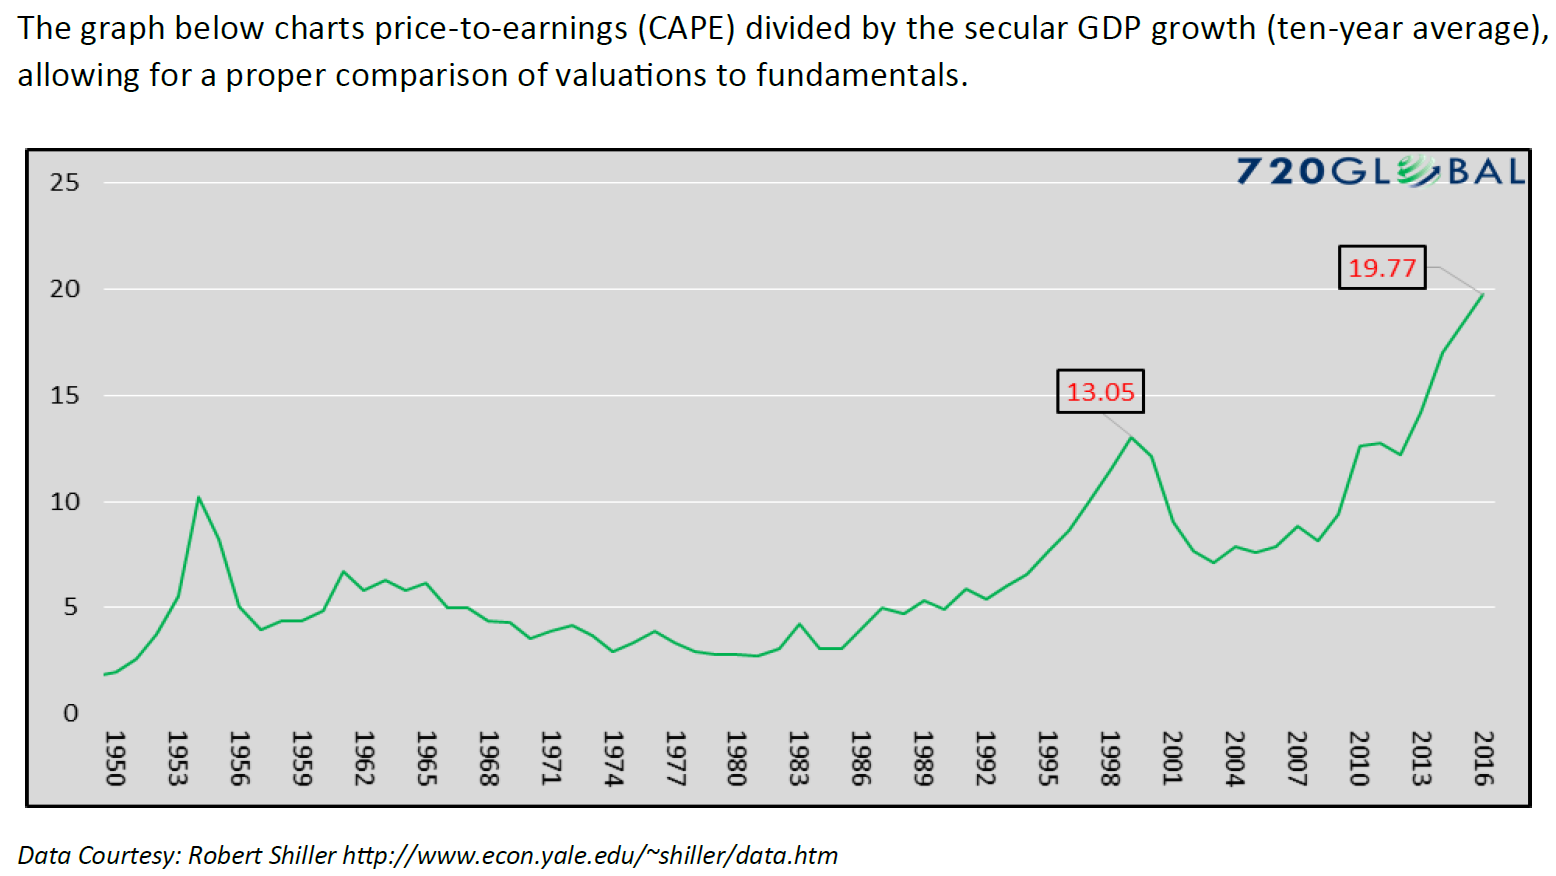
Source: 720 Global, and Robert Schiller.
Much weaker economic backdrop than 1990s
To fill in some details, we add this table highlighting some key metrics. What do we see? Not only do current valuations exceed the 1990s peak, but also the economic backdrop is much less favorable. Current GDP growth is weaker, as is the productivity growth. What’s more:
— Federal Debt more than tripled
— personal and corporate debt went up 170% percent
— the US government is running much bigger deficits
— corporate earnings have fallen over the last 3 years and are flat over the last 5 years compared with high single-digit growth back in the 1990s
— lastly, the Fed fund rate is little above 0%, while it was at 5.4% back then
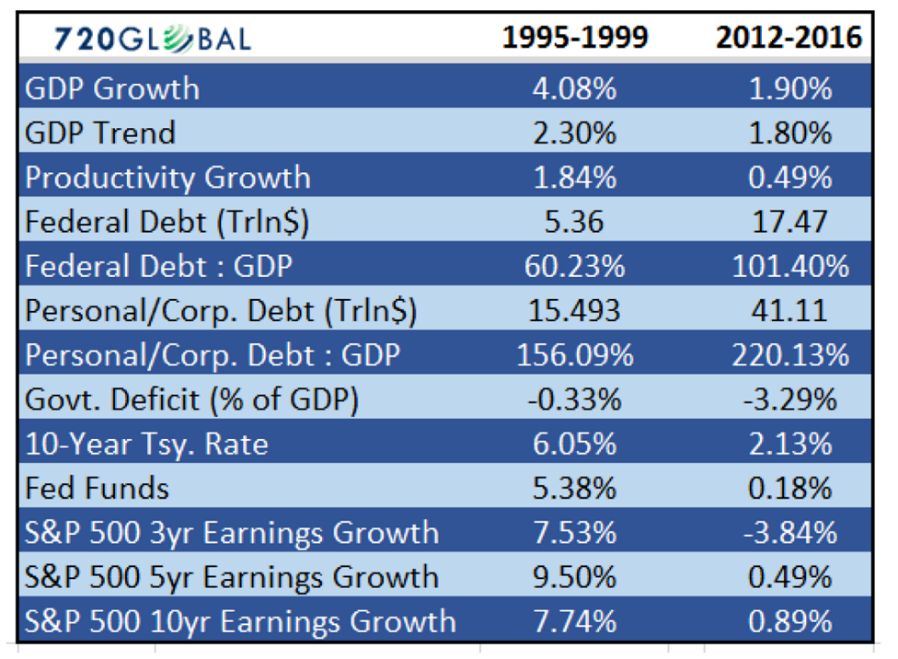
Source: 720 Global
Corporate earnings growth and economy slowing down
Investors seem to have concluded that we have to pay more than ever for the same dollar amount of earnings. If earnings were consistently growing (or even better, growing at an accelerating pace) we might be less concerned. But growth is slowing, and the underlying economy is decelerating as well.
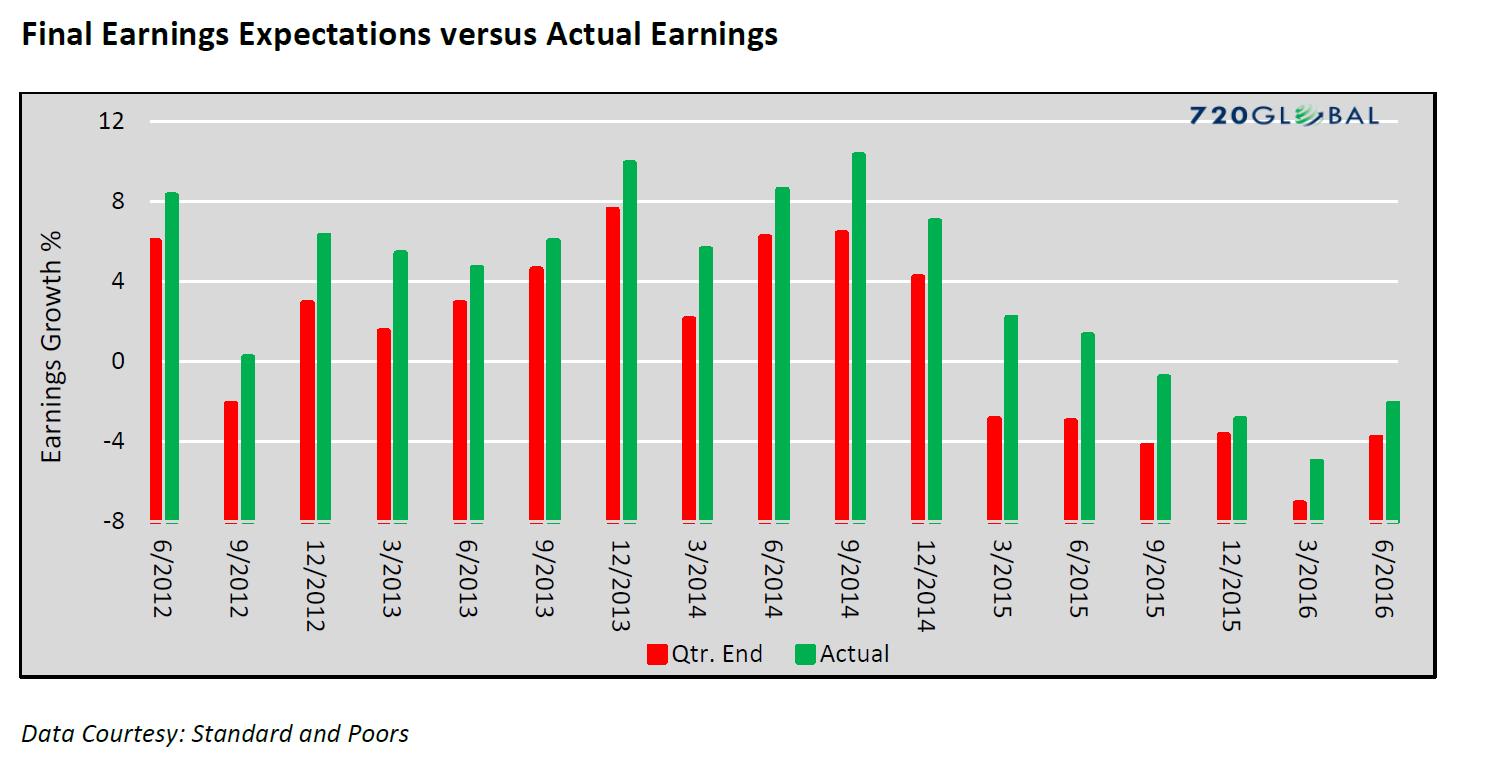
Source: 720 Global, Standard and Poor’s.
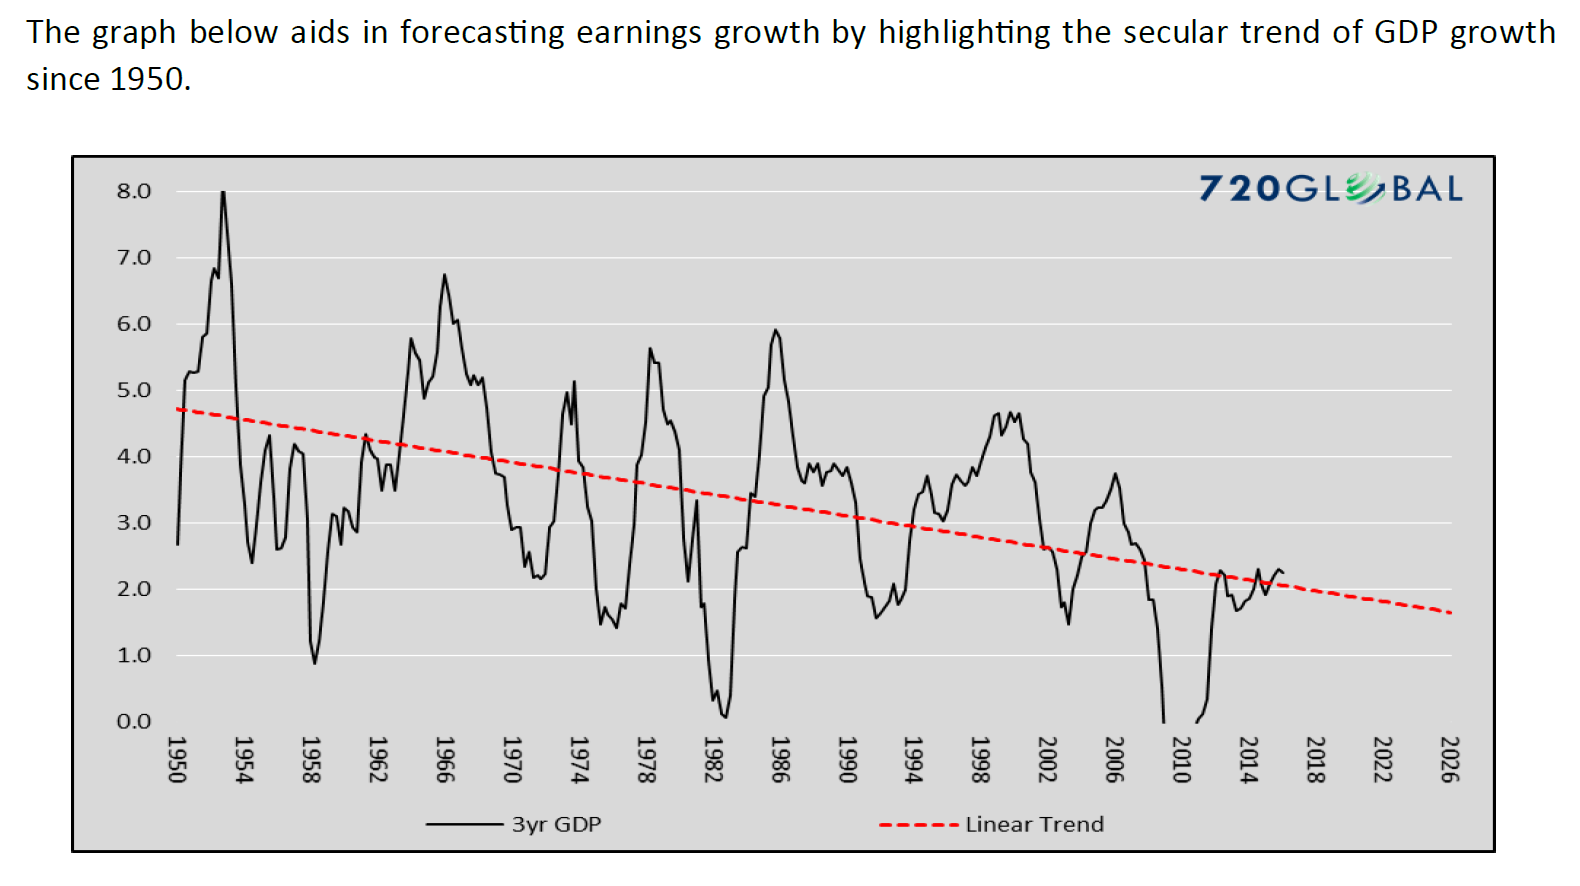
Source: 720 Global.
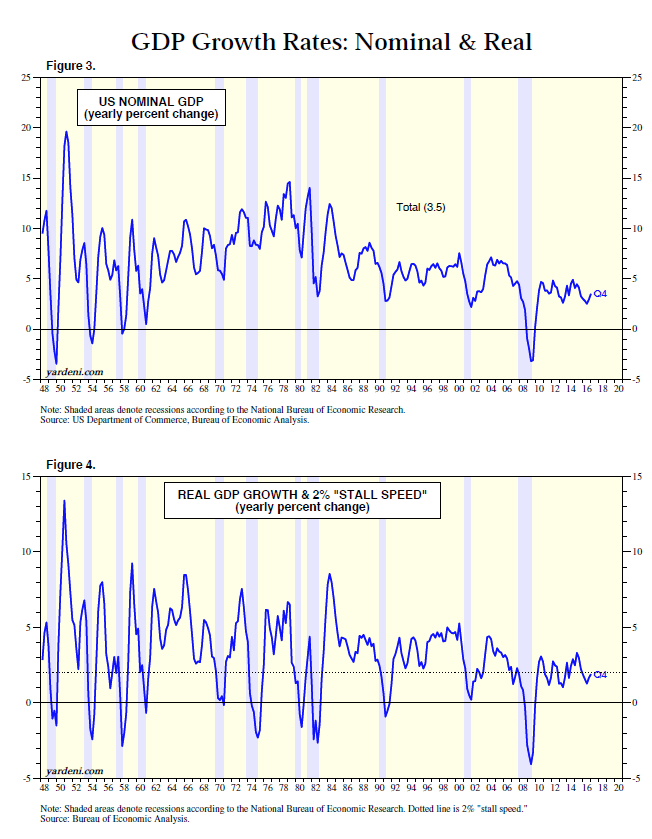
Less room to improve margins, too
As stock pickers, we like to look at margins that tell us how profitable companies are. They go up and down cyclically, as well as throughout the life of a company. Even when growth is slowing there is sometimes hope for better margins, which could lead to an acceptable earnings trajectory. Here, the picture is equally concerning. S&P 500 margins are also at their peak, making it harder and harder for companies to show further earnings improvement. On top of it, the majority of the margin expansion since the Great Recession came from lower cost of borrowing, which with record low rates can’t go much lower.
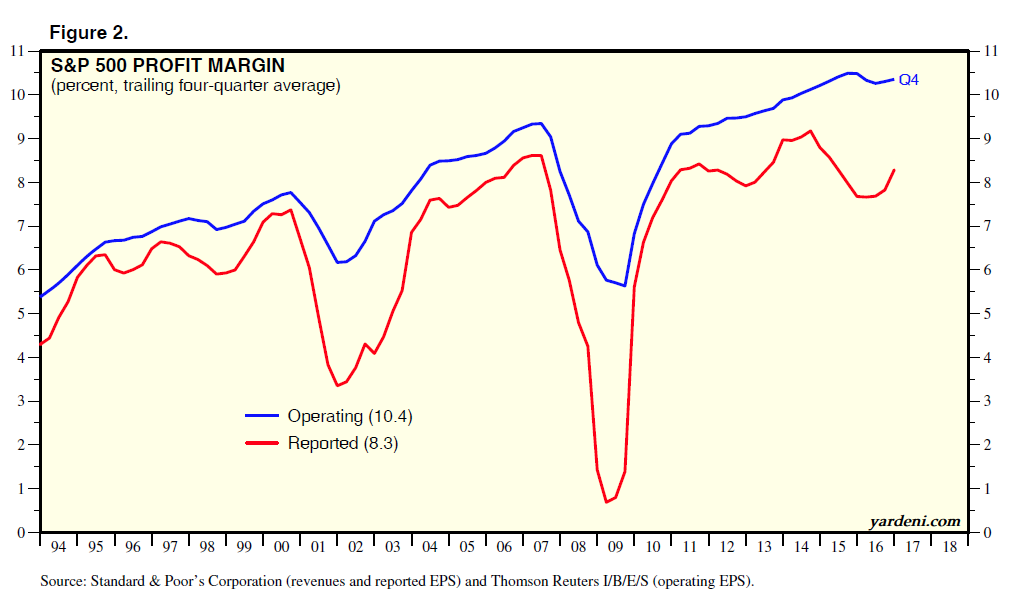
Source: Yardeni.com, Standard & Poor’s Thomson/Reteurs I/B/E/s.
Buybacks helped cover up slowing growth
Prices and margins are at all-time highs while growth languishes: bad enough. But the growth of earnings per share growth would have been even weaker if we excluded the benefit of unprecedented repurchase programs. Companies sometimes choose to spend their cash flow and borrow cheap money to buy their own shares and shrink the share count, creating an illusion of earnings per share growth. If buybacks take place when the stock prices are low and investment opportunities limited, they might be applauded by the investor community. Currently, though, we’re concerned by how highly the market values truly weak earnings performance.
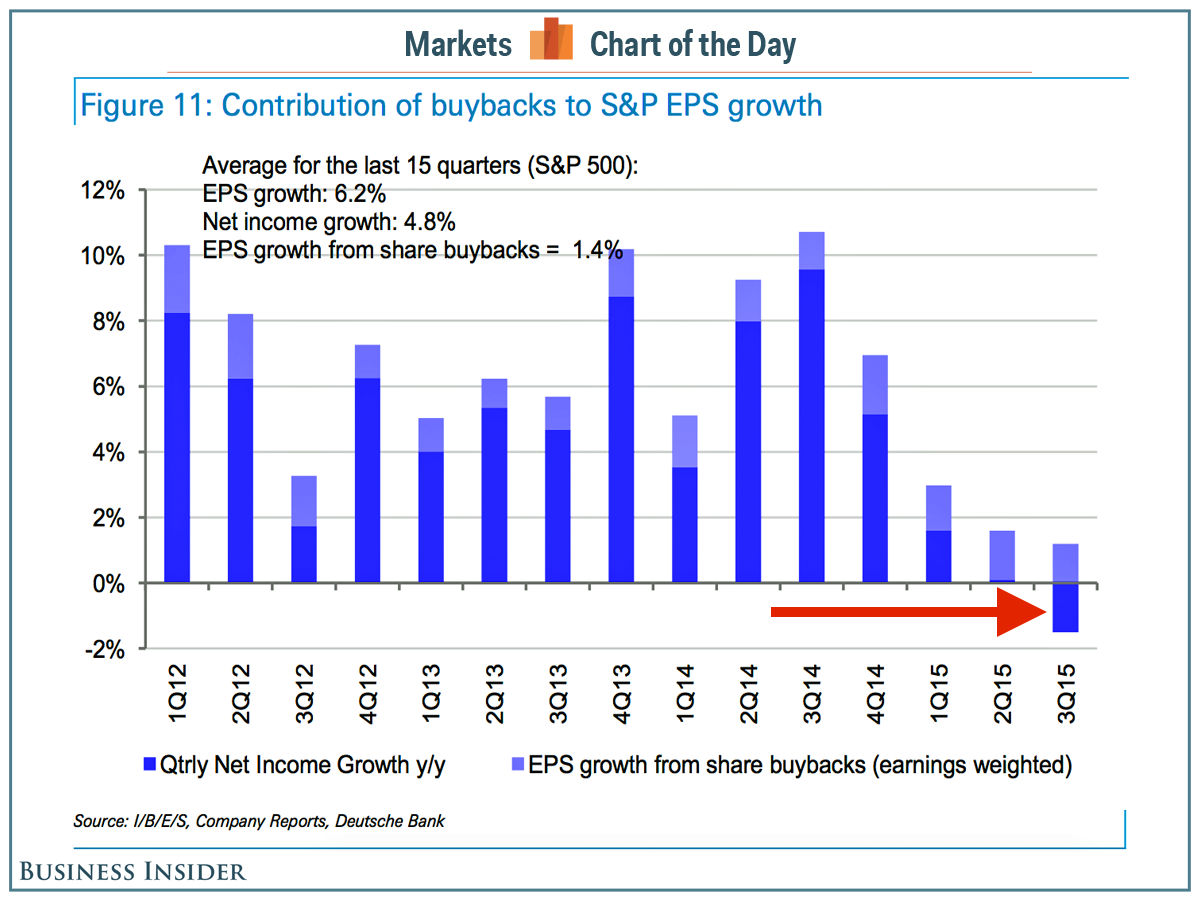
Source: Business Insider.
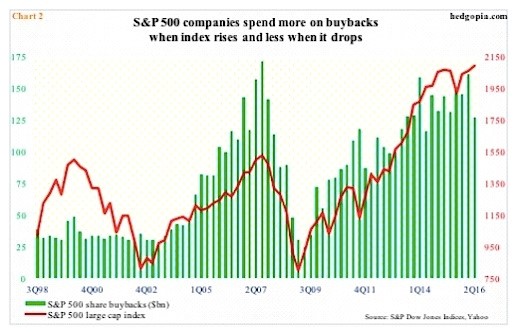
Source: Hedgopia.com
Let’s get this growth going then!
You might say: “But we can cut the rates, start a monetary and fiscal stimulus, and growth will come back.” In theory, yes. The truth, however, is that over the last 9 years the US has been doing both at unprecedented levels.
Record low rates, record high debt, record easy money policies
Declining growth and fear of deflation have led the government and the Federal Reserve to deploy the biggest-ever fiscal and monetary stimulus. The rates hovered near zero, public debt ballooned, and the Federal Reserve has become the biggest buyer and holder of government’s debt. It’s a pattern that we have seen around the world – Europe and Japan are in the same predicament.
I. What happened to interest rates?
Looking at 150 years of rates policy, the chart speaks for itself. We have never had a period of zero rates before. In other words, there has never been a monetary stimulus of bigger proportions.
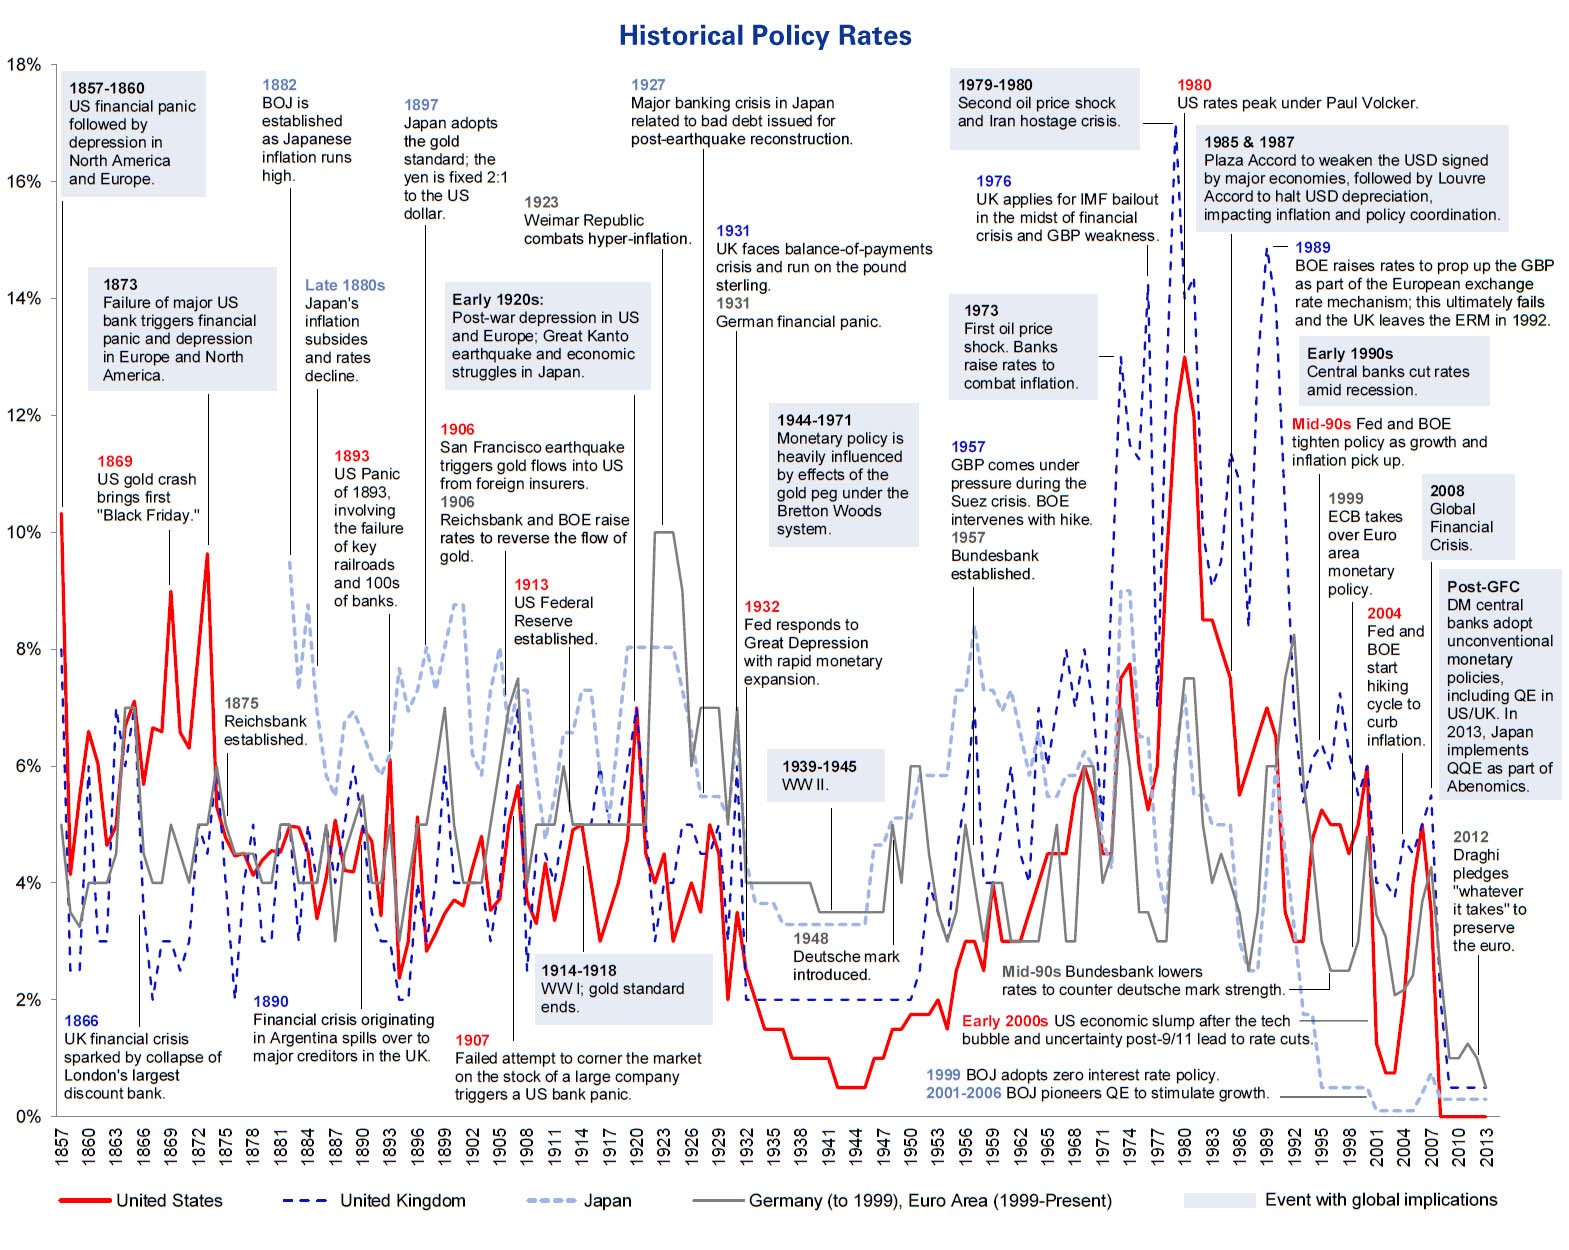
Source: ZeroHedge, Goldman Sachs.
II. What happened to government debt?
It’s been soaring; the government has been unable to resist the allure of more cheap debt. Lower taxes and the big infrastructure spending that we’ve been hearing about seem to be more of the same– both lead to even greater indebtedness.
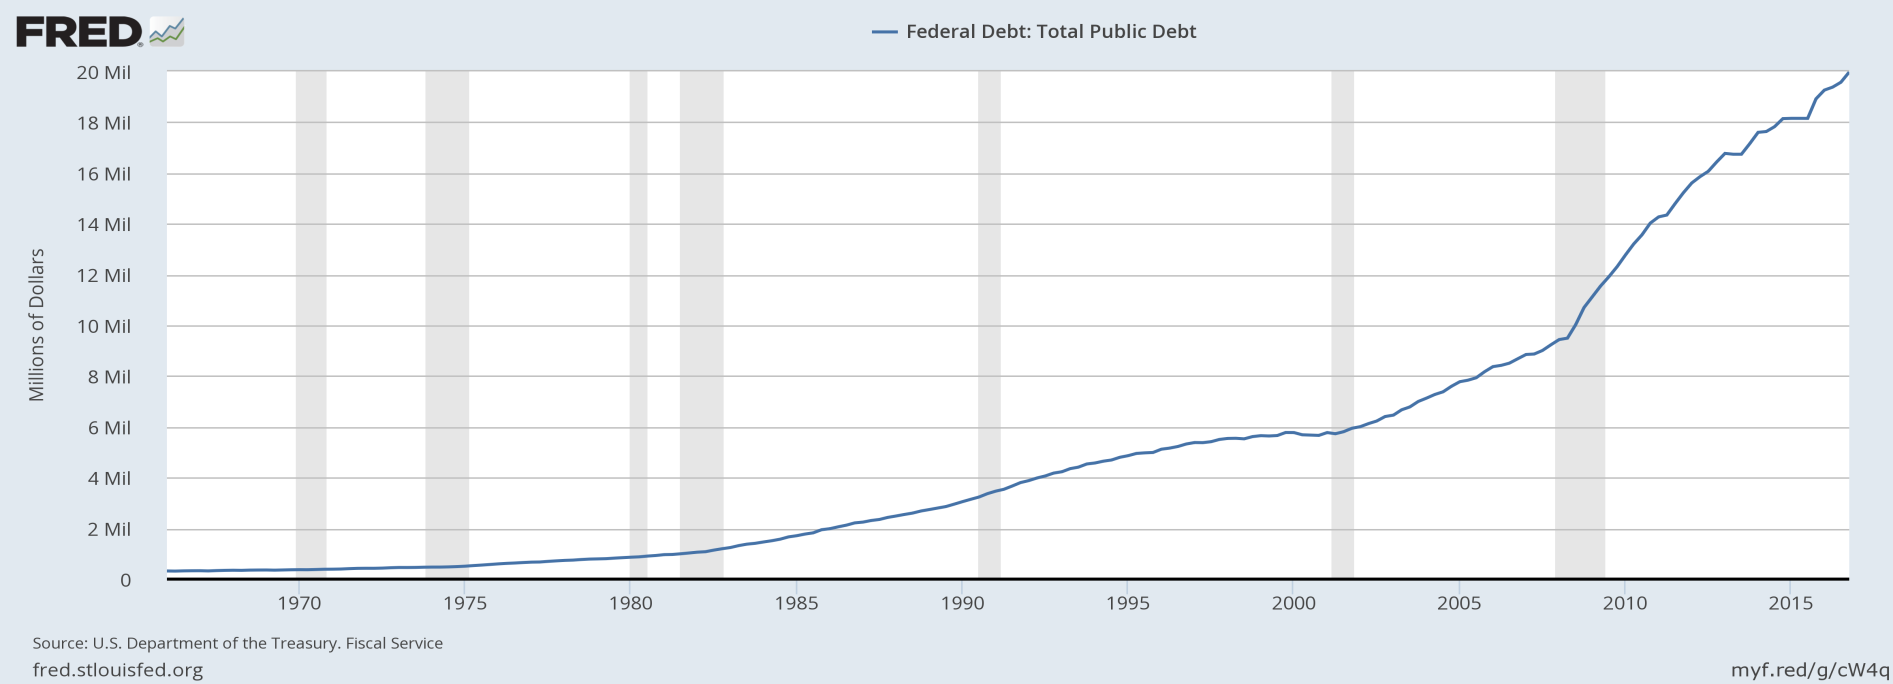
Source: U.S. Department of the Treasury, St Louis Federal Reserve
To put it in context, we haven’t seen government debt like this since WWII, when the country was building up capacity to face the biggest war the world ever fought.
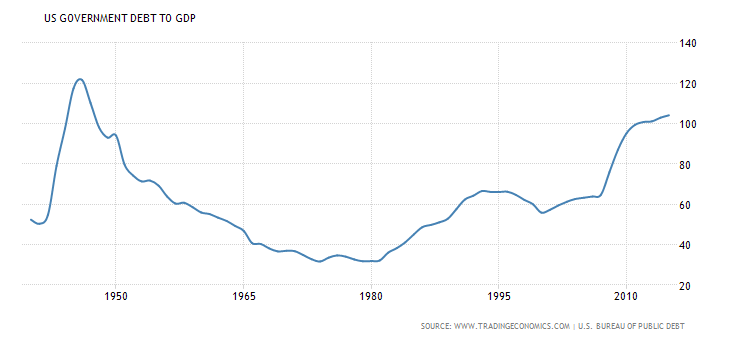
Source: www.tradingeconomics.com
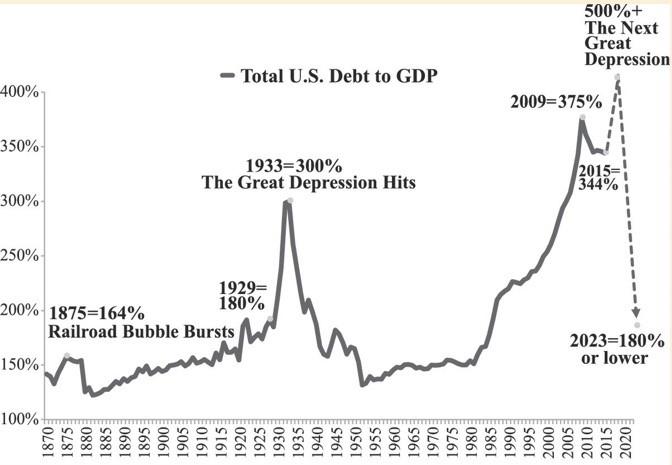
It’s not just government debt that concerns us: total debt is at staggering levels, too.
Source: Dent Research.
III. What about the Federal Reserve?
Since the late 1940s, there hasn’t been comparable participation in the market on the part of the Federal Reserve. The Fed expands its balance sheet by “printing” money and buying government bonds, mortgage-backed securities and other assets to boost the money supply, and stimulate growth. This chart ends in 2012, but the Fed’s balance sheet continued to grow further and peaked at pre-WWII era levels.
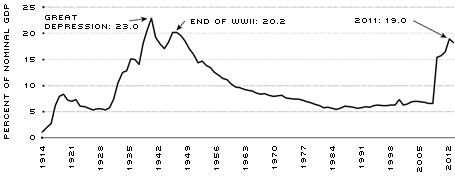
Sources: Federal Reserve Board, Bureau of Economic Analysis, Historical Statistics of the United States/Haver Analytics.
What have these strategies accomplished?
I. No deflation
The result of all of these unprecedented stimuli is twofold: deflation has been avoided, and asset prices have increased greatly. The developed world temporarily won a battle, but probably not a war against deflation. Historically, as you can see on the chart below, the world economy has regularly experienced sharp deflations and sharp inflations. Ever since the US departed from a currency tied to precious metals, we were able to easily print more currency, and increase supply of money, thereby avoiding deflation. This is a powerful tactic in the midst of recession, especially if used sporadically and for a brief period of time.
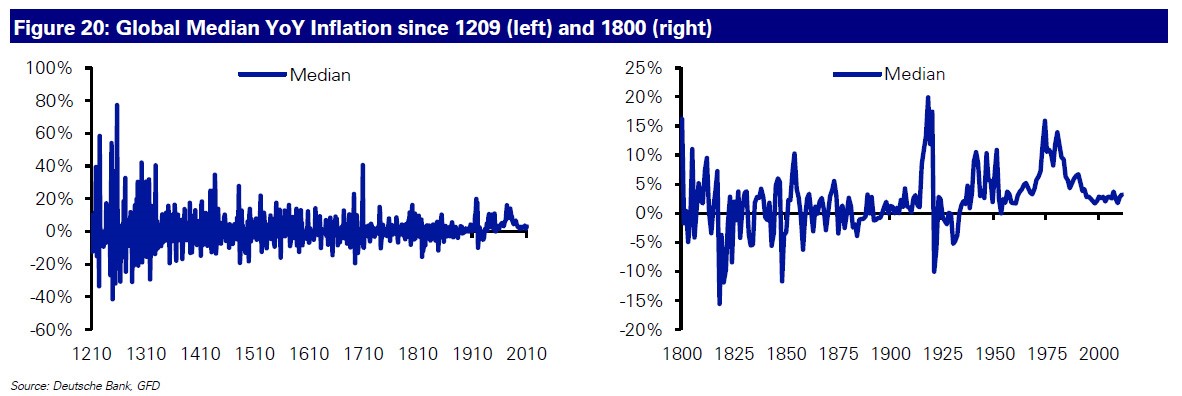
Source: Deutsche Bank, GFD.
II. Meager economic results
In the last decade, prolonged stimuli achieved limited results in terms of growth. The result instead was a slow- growth environment. The Fed fears that any tightening of monetary policy may undermine that already weak growth, and the government is equally cautious tightening its fiscal policy. We find ourselves in a corner with limited options to move further.
Source: National Bureau of Economic Research, Bureau of Economic Analysis.
All asset prices enjoyed the ride up
To anyone claiming that equities are alone in this unprecedented bonanza of growth, take a look at the home price index. These charts, looking back to the late 1800s, also remind us that home values do fluctuate, and fairly dramatically.
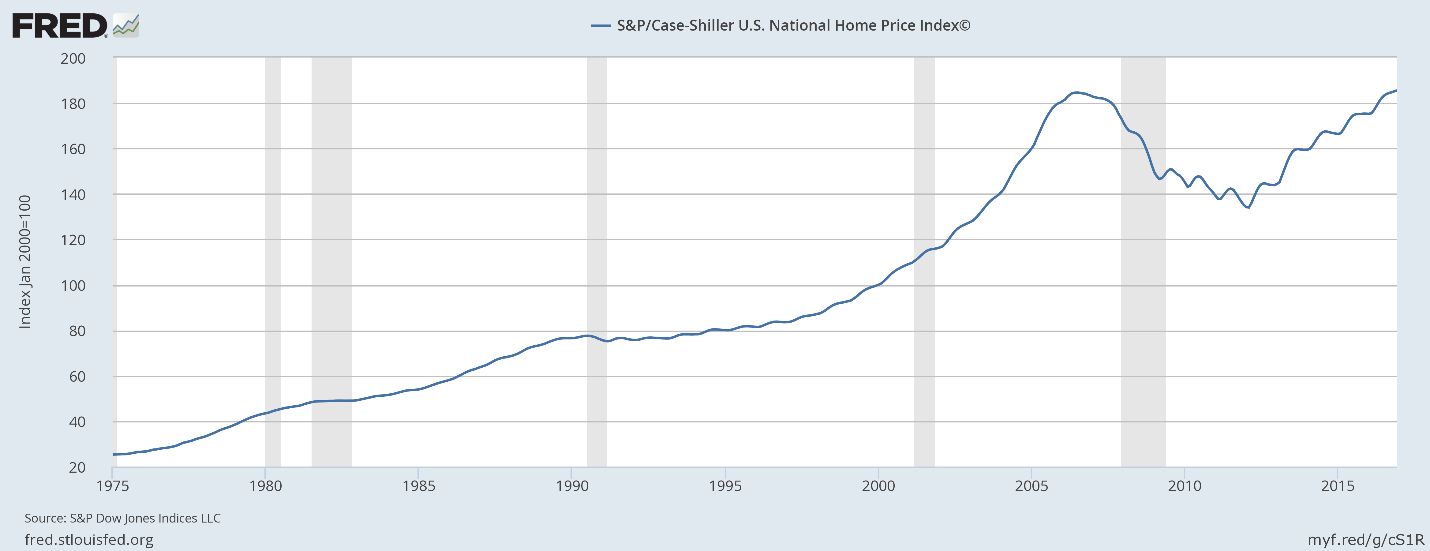
Source: St. Louis Fed, S&P, Robert Schiller.
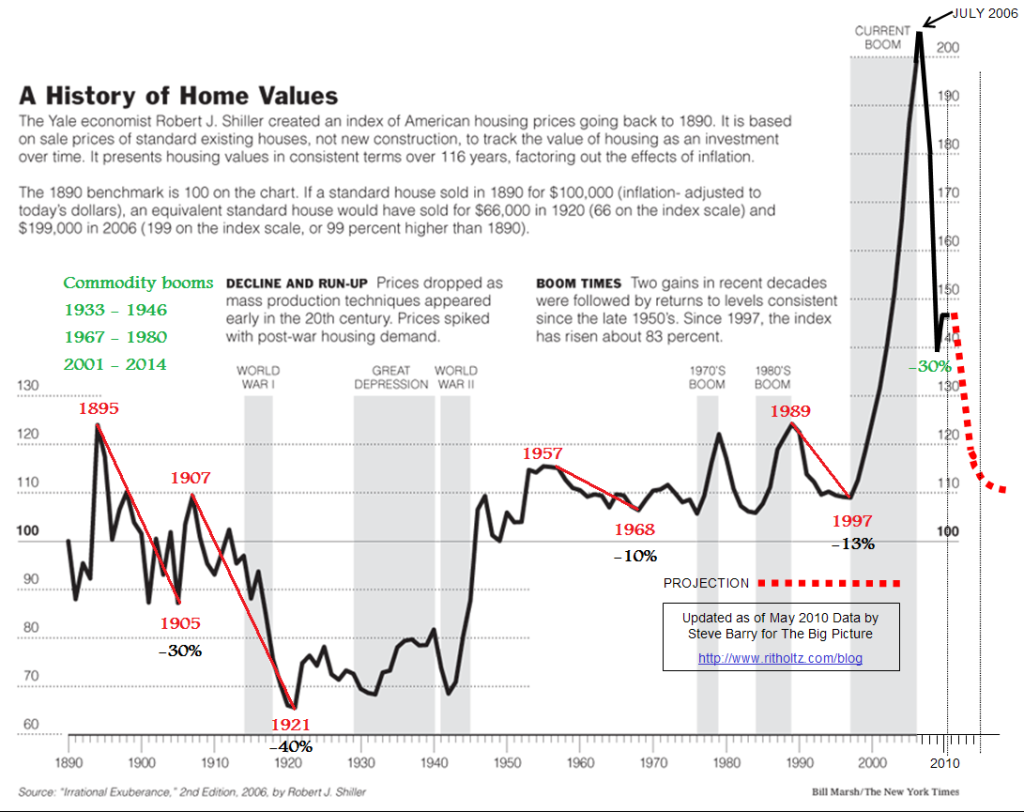
Source: Robert Schiller.
Before the bubble bursts
An interesting phenomenon always occurs right before the reality check hits investors. Those who missed out on an 8-year long bull market finally feel compelled to join. They have a hard time picking specific stocks, which on the whole are expensive and not attractive, so these late-to-the-party investors buy the broad market funds. They just want a piece of the action. That’s why we have seen days of record inflows to index funds.
Lastly, despite flat earnings for the S&P 500 over the last few years, we have witnessed a big rally since last November. The enthusiasm around the new administration with its pro-job, pro-business narrative inspired a new wave of investors. As much we would like to see lower and simpler taxes along with more efficient government, we are concerned about the protectionist tone of the current government, its mixed record on execution, and lofty expectations for its success already baked into the market prices. We believe those business-friendly policies will be slow to show benefits. Also, the more revenue-neutral they are, the less of an actual short-term boost they can bring. Finally, the recent record of the current administration invites some doubts about the overall execution of the policies to begin with.
If all that new investor enthusiasm were arriving in the midst of a recession, we would take it more seriously. However, the monetary and fiscal arsenal has already been exhausted. Further, the US is experiencing record-low unemployment, along with wage inflation. Improvement from here will require more than another dose of the same medicine. If you think protectionist tendencies and stricter immigration policies worldwide (UK’s Brexit, the French presidential election’s tone) are something new, the 1930s provide a striking – and chilling — comparison.
- Why do we believe asset prices need to come down?
Just because the asset prices are high, that doesn’t mean they have to come down, does it? Maybe Irving Fisher’s observation from 1929 will be right this time, and stocks have reached a permanent plateau. Wouldn’t that be nice?
In terms of lessons, the world has little new to offer; history may not repeat itself, but definitely rhymes more often than we are willing to admit. If that’s the case regarding the current economy, let’s see where we can find rhymes.
Our thesis: No matter what, asset prices are going down dramatically
After extensive research, we find two only two possible paths from the current situation — the proverbial fork in the road. As we mentioned earlier, the US is not the only country facing this dilemma. Europe, Japan, and many other big economies need to make a hard choice here, too.
Two potential options have both been thoroughly tried, documented, and examined.
Path #1 – tightening now
–normalized interest rates
–tightening of monetary policy
–central banks ending their participating in asset buying
–letting prices find their own natural equilibrium
–in sum, more responsible fiscal policy
Path #2 – more of the same, tightening later or never
– zero or negative interest rates
–more easy money policies with central banks buying even more bonds and equities to prop up prices (and keep rates low
–more fiscal stimulus – lower taxes, bigger spending, doubling our total debt once again
In fact, these two paths to lower prices end up looking identical. The slower version, #2, will eventually lead to path #1. It may take a while (defaults, debt restructurings, higher taxation, wealth transfers). We also know that if path #1 feels too hard, we tend fall back into path #2 again, and again (more bailouts, more easy money, more spending). We can keep kicking the can further down the road, but we can’t make it disappear.
In the real world, when a household defaults on its mortgage, car loan, and credit card debt, consequences are clear: the borrower has to tighten the belt, move to a smaller house, take a bus to work. Governments have the luxury of postponing the day of reckoning. Usually the music stops when creditors are not willing to finance the government’s massive spending. In our case, the Federal Reserve and central banks have stepped in and financed that massive public debt with their expanding balance sheets.
However, the time has come for asset prices to drop, so let’s examine the scenery on our two paths.
The US followed Path #1 in the aftermath of the 1929 market crash, either by choice or inadvertently, because it didn’t quickly implement policy changes. Japan suffered a similar fate in the years following the bursting of 1989 asset price bubble. Greece was forced on the path of austerity by its creditors since the financial crisis. All three countries experienced a huge drop in both stocks and real estate. Path #1 meant drastic declines in the GDP, high unemployment, and deleveraging of the private sector, consumers and businesses.
In response to the dramatic slide in asset values, the central banks and governments of all three countries followed up with Path #2. The outcome? In each country, a combination of Path #1 and Path #2, with a return to Path #2, when #1 proved to be too painful. The US tightened in 1937, which led to a sell-off in equities (50%). Similarly, Japan danced around a more disciplined fiscal policy, then dropped the idea for now.
Result: From the top in September 1929 of 381 to mid-November the Dow Industrial Average lost half of its value, and by mid-1932, 89%.
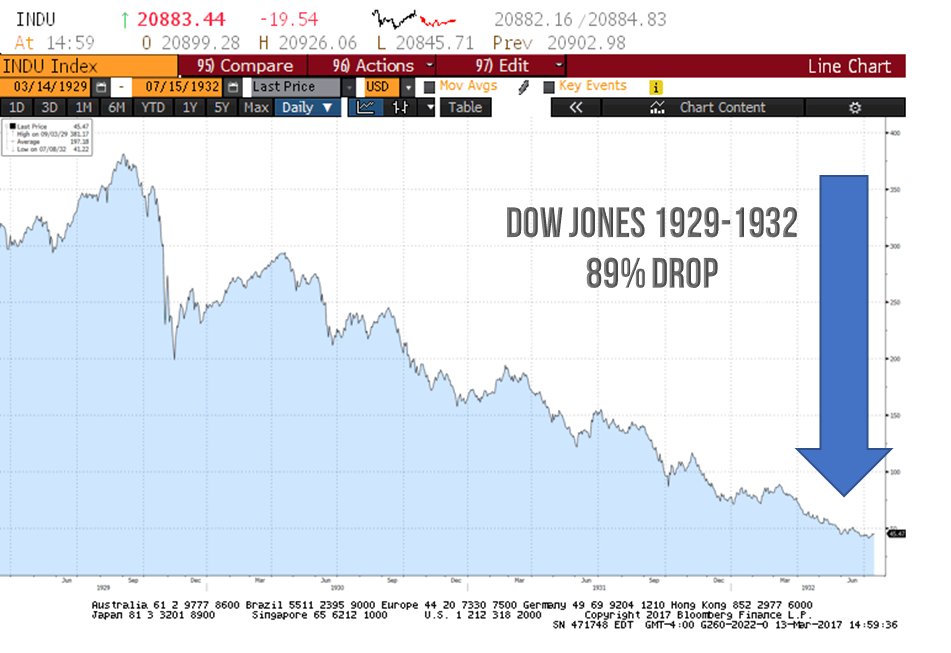
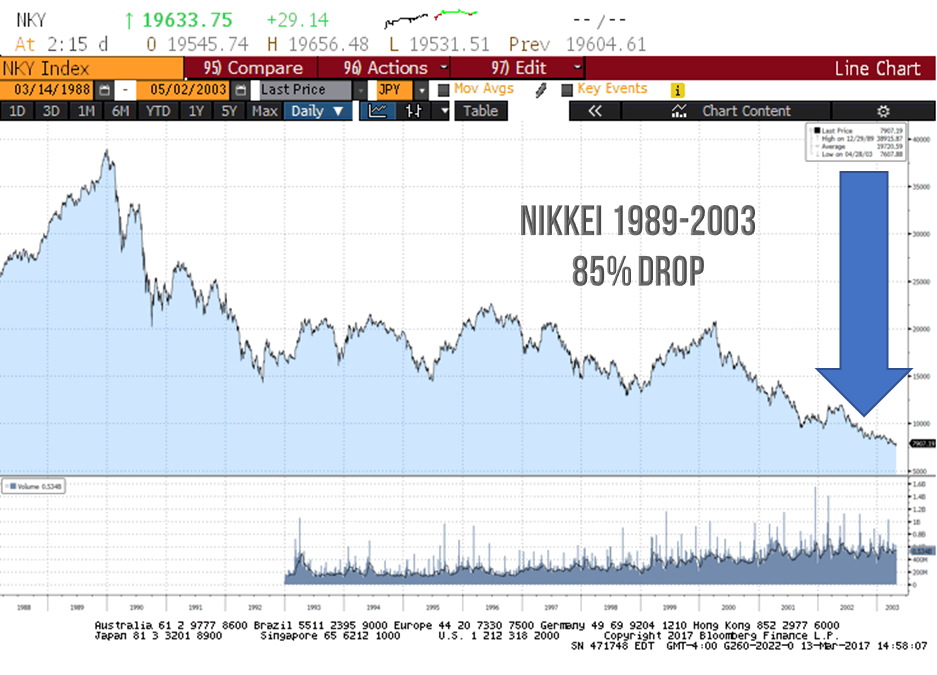
Source: Bloomberg.
Result: Nikkei fell from almost 40,000 in 1989 to 14,000 in 1992, and finally half of that by 2003. A total 85%+ drop.
Source: Bloomberg.
Result: From October 2007 till June 2012, the Athens’ Stock Exchange Index fell from 5,335 to 476, a 91% drop!
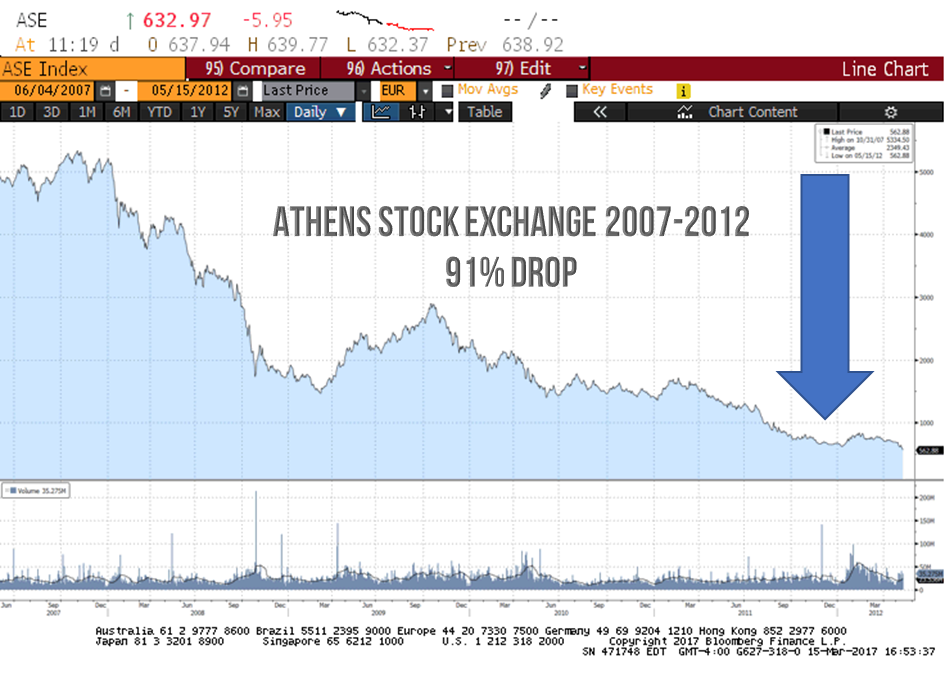
Source: Bloomberg.
Stocks are not the only assets that fall; real estate declines are equally painful
It’s important to remember that real estate price do come down. In Japan they’ve dropped by over 80% in commercial real estate. Similar losses occurred during the Great Depression in the US. Brick and mortar don’t save you in a world where there no buyers for your asset, no matter what unprecedented price you paid for it.
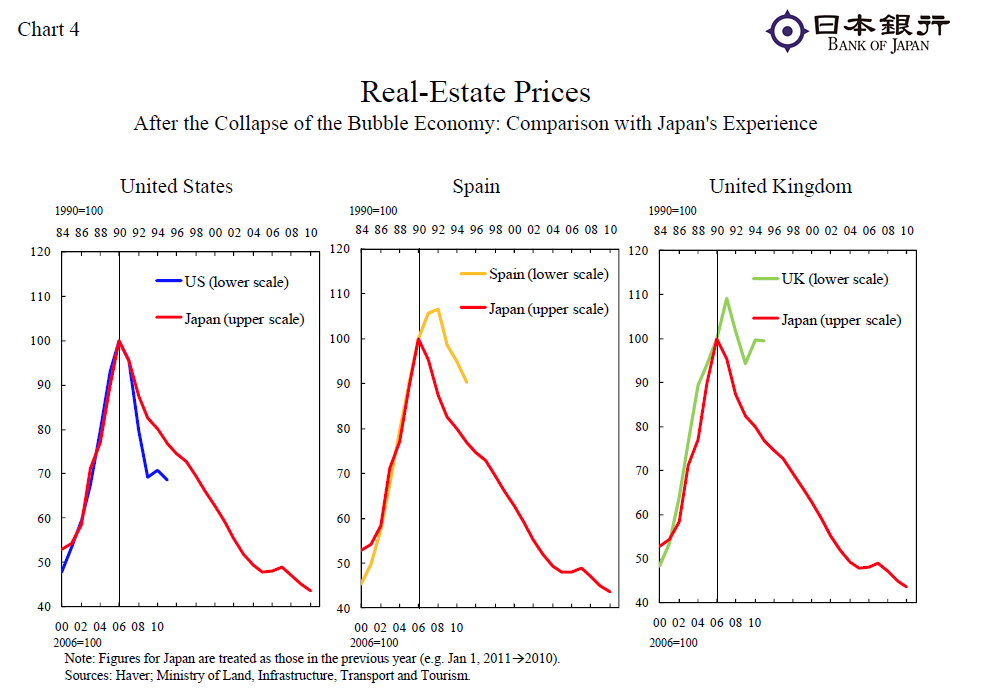
Source: Haver, Ministry of Land, Infrastructure, Transport and Tourism, Bank of Japan.
The day of reckoning might be postponed: the asset prices react regardless
If a government has debt in the currency it controls, the day of reckoning may be long postponed (let’s watch the Bank of Japan setting a record in that department). The central bank will buy the government bonds and print money to pay for it. If this maneuver is managed well it will lead to Japan’s scenario. The danger is the Weimar Republic’s experience of galloping inflation. Sure, the debt gets wiped out, but so do all the assets, and the economy ends up in complete ruin. It’s the threat of this scenario that has inspired the gold craze of the last 15 years.
The zombie economy – mispricing and poor allocation of resources
Japan’s experience is often referred to as “two lost decades” though it will soon become three. It led to mispricing of assets, poor allocation of resources, and what some call a “zombie economy” which maintains high employment, but without growth has no chance to unwind excess fiscal and monetary expansion.
All the stimuli disappoint. Why is nothing working?
Five years ago, Masaaki Shirakawa, then-Governor of the Bank of Japan, gave a lecture at the London School of Economics and Political Science entitled “Deleveraging and Growth: Is the Developed World Following Japan’s Long and Winding Road?” Speaking of the “two lost decades” in Japan, he blamed the first decade’s stagnancy primarily on the bursting of the Japanese bubble economy. The second decade he pinned on demographics. A population that is both ageing and declining in numbers, he believes, contributes to the decline in growth potential, a deterioration in the fiscal balance and a fall in housing prices. He also concurs with another central banker, Mervyn King (Bank of England) who said that “there is a limit to what monetary policy can hope to achieve.”
What role will demographics play?
This is a topic for another article, but the post-war baby boom may have helped us experience the longest bull market (if you count early 1980s as its true beginning) and the biggest asset inflation in stock market history. Now that generation begins to shift from working, spending, and investing to retiring and selling their stocks. Their 401k and IRA contributions will become withdrawals and they may downsize their homes.
Many studies suggest a 5-10 year hiccup in consumer demand before the peak of the next generation will step in the shoes of the Baby Boomer generation. That hiccup started in Japan earlier, and is now taking shape in the US and Western Europe. It will soon affect China as well. Maybe there is a lesson there to be learned for economists, central bankers, and governments. Maybe traditional fiscal and monetary tools fail us when we are up against major demographic shifts.
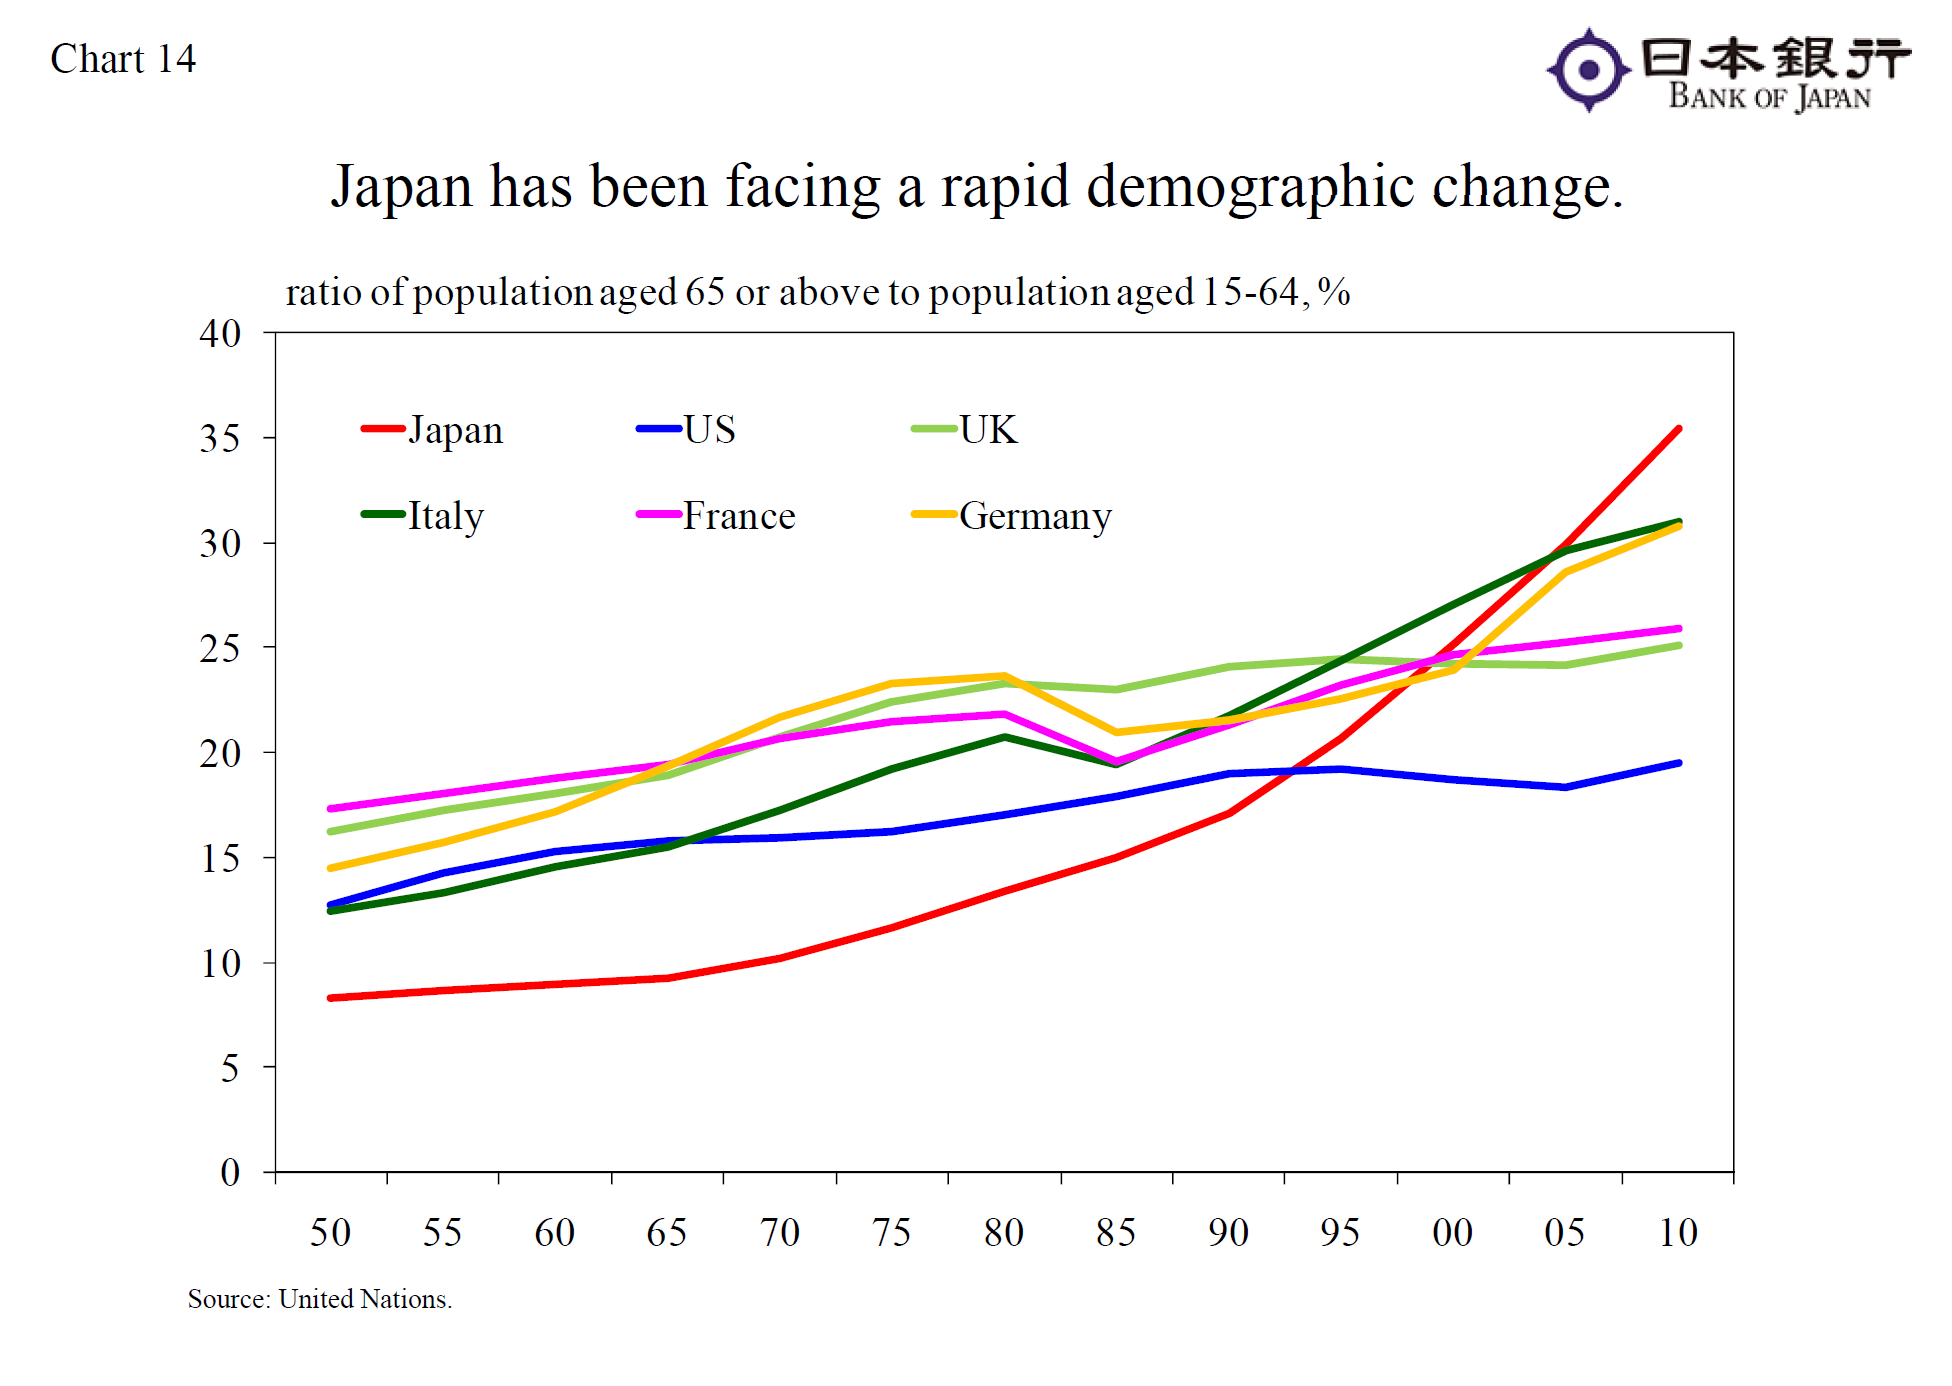
Source: United Nations Bank of Japan.
3. How can we position ourselves now to take advantage of opportunities later on?
How does this bubble burst?
As much as we worry that less favorable demographic trends will turn into a major headwind for the next 5-10 years instead of providing a tailwind as in recent years, the catalyst for a near-term bursting of the economic bubble could come from many directions. Will it be the Fed raising rates? This would hike the cost of debt, thus possibly causing a decline in lending, which would prompt a drop in demand and produce another recession.
Or what if a major financial institution like Deutsche Bank were to fail, with its immense derivative book the size of a multiple of the German GDP? Could the Greek government default again? Are there more political surprises brewing in Europe, or the US for that matter Escalating military conflicts? We don’t know. What we do know is that bubbles always do burst.
The fallacy that “this time is different”
If you think there is nothing to be learned from the past, we’ll borrow Bernard Baruch’s advice from his memoir. In the midst of the 1929 craze, he would go back and re-read a classic book called Extraordinary Popular Delusions and the Madness of Crowds published in 1841 by Scottish journalist Charles Mackay. Mackay demonstrated how bubbles get created, and how quickly and unexpectedly they burst. Baruch took note and sold early. We don’t claim to be smarter than this ground-breaking financier. Nevertheless, we do see the facts, draw conclusions, and choose to be contrarian by patiently staying underinvested. This better positions our clients for the day when the market exhausts itself, and finally corrects. At that point, we will be ready to take advantage of the opportunities that will doubtless appear.
The best markets, the best investment periods, and the biggest fortunes all started with truly bad markets. As contrarians, we choose to cautiously avoid getting sucked into the momentum and enthusiasm-driven rallies of a very tired bull market. We are, on the other hand, looking forward to buying opportunities when the bubble unravels.
Where to hide?
Stocks and real estate are both vulnerable to a bursting bubble. Cheap money has distorted pricing across most asset classes. There are though some safer pockets of the equity markets, and those much more vulnerable.
Fixed income? If the rates do go up, long term bonds will be under pressure, and obviously lower quality bonds will disappoint in a recession.
Gold? If we were to experience a Weimar Republic-style hyperinflation, gold would be the right asset. The difference between now and 1920s Germany is clear. Central bankers are not creating inflation in goods and services. Instead they are fighting deflation at all costs, while creating inflation in asset prices. We could envision a small exposure to gold as an insurance against prolonged irresponsible fiscal and monetary policy.
Cash, treasury bills, and short term bonds, ideally under 1 year with very short duration (sensitivity to rate changes) are the safest place to wait out this peculiar time. While they may not be earners, cash and cash equivalents will most likely hold the same face value in times of distress. In other words, the same $100 bill that would buy only two Starbucks shares in 2006, would buy four in early 2008, and more than ten shares at the market lows in early 2009.
We intend to patiently hold on to those $100 bills until we can get the most for the money.
Bogumil Baranowski
4/12/2017
Disclosure: This report is not intended to be a client‐specific suitability analysis or recommendation, an offer to participate in any investment, or a recommendation to buy, hold or sell securities. Do not use this report as the sole basis for investment decisions. Do not select an asset class or investment product based on performance alone. Consider all relevant information, including your existing portfolio, investment objectives, risk tolerance, liquidity needs and investment time horizon. This report is for general informational purposes only and is not intended to predict or guarantee the future performance of any individual security, market sector or the markets generally.