Beyond The Headlines
RCA, NIFTY FIFTY, AOL and FANGs

Back in 1999, at the peak of the dot.com bubble, I wrote an article for Tocqueville Asset Management, the firm I had founded in 1985. It was entitled “AOL, RCA and The Shape of History” (Tocqueville Asset Management, December 1999) and was inspired by the chart below, borrowed from that Thanksgiving’s issue of The New Yorker. It compared the 1920s bubble in the shares of RCA to the stock performance of AOL in the late 1990s:
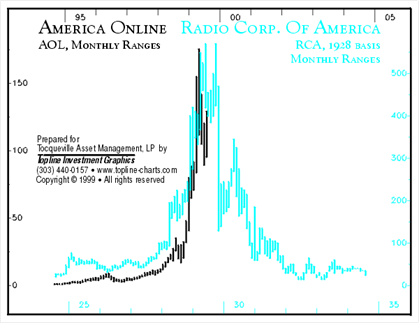
As a preface, I quoted from a report prepared for RCA in 1929 by Owen Young, then Chairman of General Electric, about radio in the 1920s: “[It] has helped to create a vast new audience of a magnitude which was never dreamed of… This audience, invisible but attentive, differs not only in size but in kind from any audience the world has ever known. It is in reality a linking-up of millions of homes.”
It was clear to me that radio — especially when combined with the growth of automobile and air transport — revolutionized the perception of space and time in the 1920s, just as the Internet and globalization are doing today. It also reminded me of a piece of sage investment wisdom: never invest in a company that promises to change the world. The point is not that the most promising companies do not deserve their reputation. Rather it is that, once a business’s prospects are widely recognized, those prospects affect its stock price, often dramatically. This makes the risk/reward ratios unacceptable.
The story of radio is instructive: it did change the world and “disrupted” traditional news and advertising media. In the six years between 1922 and 1928, sales of radio sets rose from $60 million to $843 million! RCA, as the largest manufacturer of radio sets and also the leading broadcaster, saw its earnings grow from$2.5 million in 1925 to $20 million in 1928; its stock price rose from $1.50 in 1921 to a high of $549 in 1929. Yet few of radio’s early developers and participants made lasting gains from this, as competition and industry changes eroded the hoped-for profits.
As Mark Twain is reputed to have said: “History does not repeat itself but it rhymes.” My own explanation of the shape of History is illustrated in the following graph.
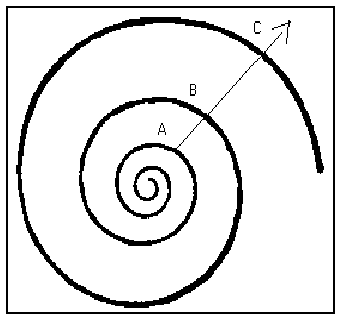
In this illustration, point B will display enough similarities with point A so that economists with a good memory will experience a strong sense of déjà vu. Yet, between these two periods, many structural changes will have taken place – in societies, in world trade and in technology, for example. As a result, point B will resemble point A, but it will also be different enough that precisely forecasting what C will look like or when it will occur is all but impossible. The only certainty (for me) is that there will be a point B.
Investors in RCA at the top of the 1929 speculative boom were right about radio’s fundamentals: the number of households with radio sets grew from 2.75 million in 1925 to 10.25 million in 1929 and, through the Great Depression, to 27.5 million in 1939. But the investors were wrong about RCA’s stock price. As we see in the chart below, included in a November 2002 follow-up paper, the fate of AOL’s stock following the 1990s dot.com boom was not very different.
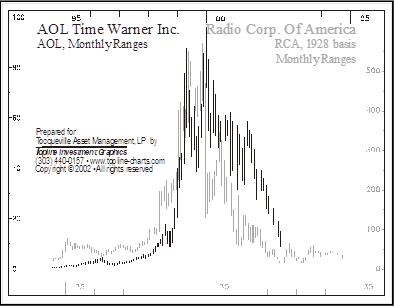
AOL was selected to illustrate what happened more generally to internet stocks once the dot.com bubble burst. I hope the following graph will awaken in our readers some memories of how history often rhymes:
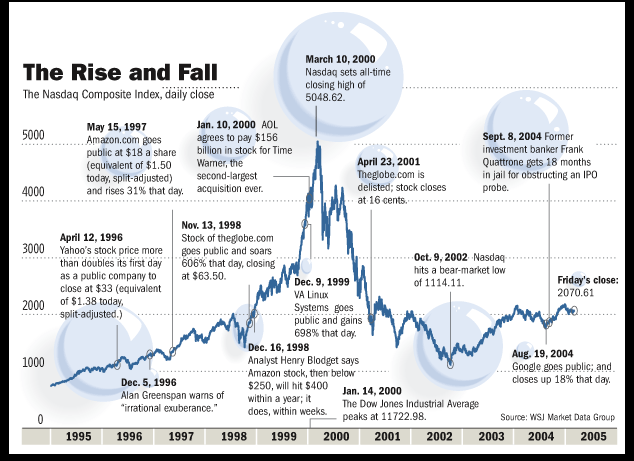
Source: Wall Street Journal Data Group
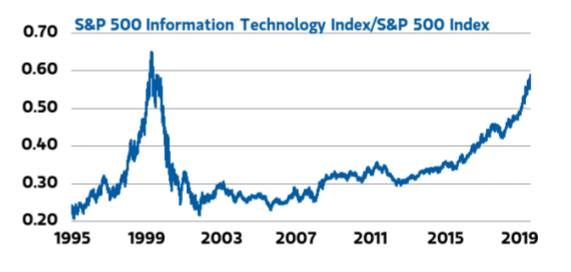
What triggered the current article was my watching the stock market performance of many of the new industries, as illustrated by the so-called FANG stocks (Facebook, Amazon, Netflix and Google) as well as those of some other “disruptors.” The chart below of the performance of the S&P 500 information technology index relative to the total S&P 500 index gives some idea of the disparate performances of the “disruptors” against the overall index. The ratio of the two is close to the level it had reached at the top of the dot.com bubble, in 1999.
Source : FT Market Forces, JUNE 29 2020
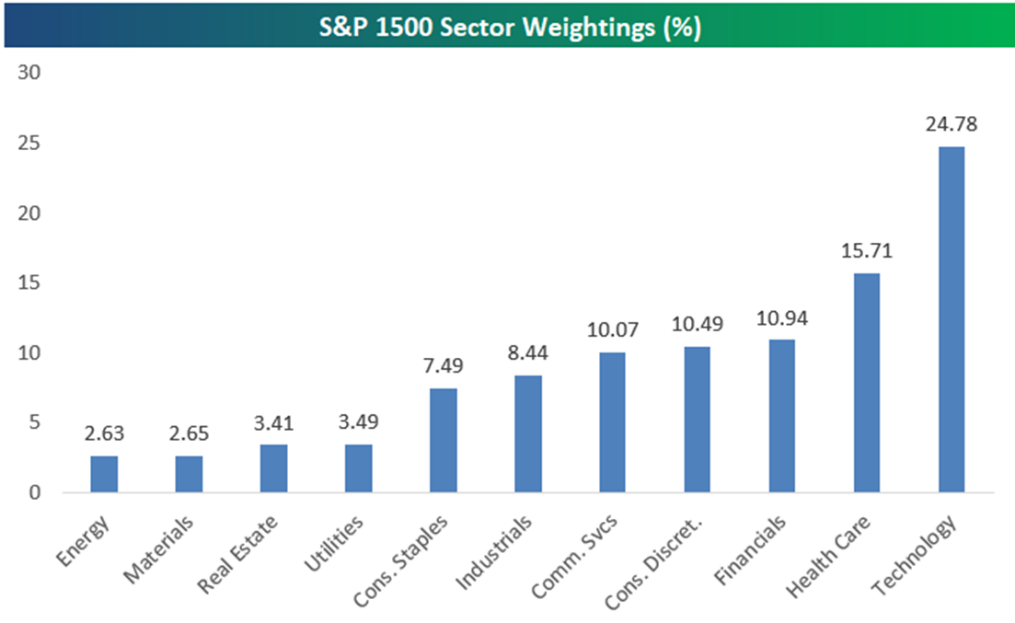
Particularly striking is the fact that the technology and health care sectors now represent 40% of the total capitalization of the S&P 500 index. Furthermore, the four companies in the so-called FANG index account for 22% of the total capitalization of the 500 companies in the S&P index. (Note: this index only counts 4 companies since both shares classes of Google, which are listed separately, are included). If we also included Apple and Microsoft, the so-called FAANGM would add up to 25% of the capitalization of the S&P 500.
Source : BESPOKE 4/20/20
Needless to say, the weight of these new-era leaders in the leading indexes has been a major factor in the behavior of the market as we usually follow it. For example, the “narrow” FANG index has risen almost 62% year-to-date while the total S&P 500 index has gained only 4.8%. Furthermore, since the FANGs are included in the broad index, we can infer that the rest of the market has not gained much in this “great” recovery.
One of the most reliable signals of market excess is its narrowing breadth – when the performance of a relatively narrow sample of companies takes off, while the broad market fails to follow. The “Nifty Fifties” in the 1970s were such a sample, which few of today’s investors can remember first-hand. Major institutional investors had been traumatized by the unexpected 1969-1970 recession on the heels of a long and prosperous expansion that had led a number of reputable economists to declare the economic cycle vanquished and recessions a thing of the past. As a result, these institutional investors had concentrated their portfolios on fifty or so companies of the highest quality. They had potential to grow fast and were considered “recession resistant.” This relatively small sample did temporarily outperform the economy and especially the stock market, hence their nickname of the “Nifty Fifty.” (They were also known as the “Vestal Virgins” because analysts could find no fault in them.)
Something similar happened in the late 1990s with the dot.com companies around the development of the Internet, an episode which many younger investors remember, even if they have forgotten AOL and other Internet pioneers.
Both of these episodes were initiated by smart and sophisticated people, expert at articulating the case for the companies or the industries they were promoting. The problem arose when a large crowd of investors joined them, pushing up prices to unreasonable levels. In each of these examples, a small sample gained a price advance against the market at large, which is why the breadth of the market advance deserves attention.
In my view, a similar fad has developed with the FANGs or FAANGMs today. The details and the techno-socio-economic environment may differ, but we should not forget that History usually does rhyme… eventually.
François Sicart – July 3rd 2020
Disclosure:
The information provided in this article represents the opinions of Sicart Associates, LLC (“Sicart”) and is expressed as of the date hereof and is subject to change. Sicart assumes no obligation to update or otherwise revise our opinions or this article. The observations and views expressed herein may be changed by Sicart at any time without notice.
This article is not intended to be a client‐specific suitability analysis or recommendation, an offer to participate in any investment, or a recommendation to buy, hold or sell securities. Do not use this report as the sole basis for investment decisions. Do not select an asset class or investment product based on performance alone. Consider all relevant information, including your existing portfolio, investment objectives, risk tolerance, liquidity needs and investment time horizon. This report is for general informational purposes only and is not intended to predict or guarantee the future performance of any individual security, market sector or the markets generally.