Beyond The Headlines
EXPERIENCE, PRINCIPLES AND STRATEGY – PART I
This review of what shapes our investment strategy could have wound up being quite long. We therefore elected to first review some lessons of experience and the unbending principles that guide our attitudes toward investment over the cycles. In a coming paper, we will describe how the two interact to yield our investment strategy.
EXPERIENCE
A few weeks ago, I had lunch with my old friend and colleague Jean-Marie Eveillard, an investment manager whose career has been as long as mine and quite successful, including the stewardship of one of the first global funds from $15 million to $50 billion and a Lifetime Achievement Award from Morningstar. But his feat I envy most is his statement during the Internet bubble of the 1990s, which we both shunned, that: “I would rather lose half my shareholders than lose half my shareholders’ money”.
Over lunch, we naturally wound up reminiscing about the speculative bubbles we had lived through and their aftermaths.
The Nifty Fifty Stocks and the Two-Tier Market
Of course, we remembered the beginning of the 1970s, early in our careers, when 50 stocks, the “Nifty Fifty”, came to be viewed as “one-decision” stocks due to their assumed continued fast growth, high margins and perceived resistance to recessions and disruptions (most of them had survived well the 1970 recession, shortly after a leading economist had proclaimed “we have conquered the economic cycle”).
As a result of this extrapolation, these fifty stocks were aggressively accumulated by major institutions and were largely responsible for the extent of the bull market of the late 1960s and early 1970s. But that performance came at a price. In 1972, the S&P 500 Index’s P/E already was 19, but the Nifty Fifty’s average P/E had reached 42x with Polaroid at 91x, McDonald’s at 86x, Walt Disney 82x and Avon Products at 65x.
Not surprisingly, in the stock market collapse of 1973-74, the Dow Jones Industrial Average fell 45% in just two years while, for example, Xerox lost 71%, Avon 86% and Polaroid 91%.
The Japanese Bubble
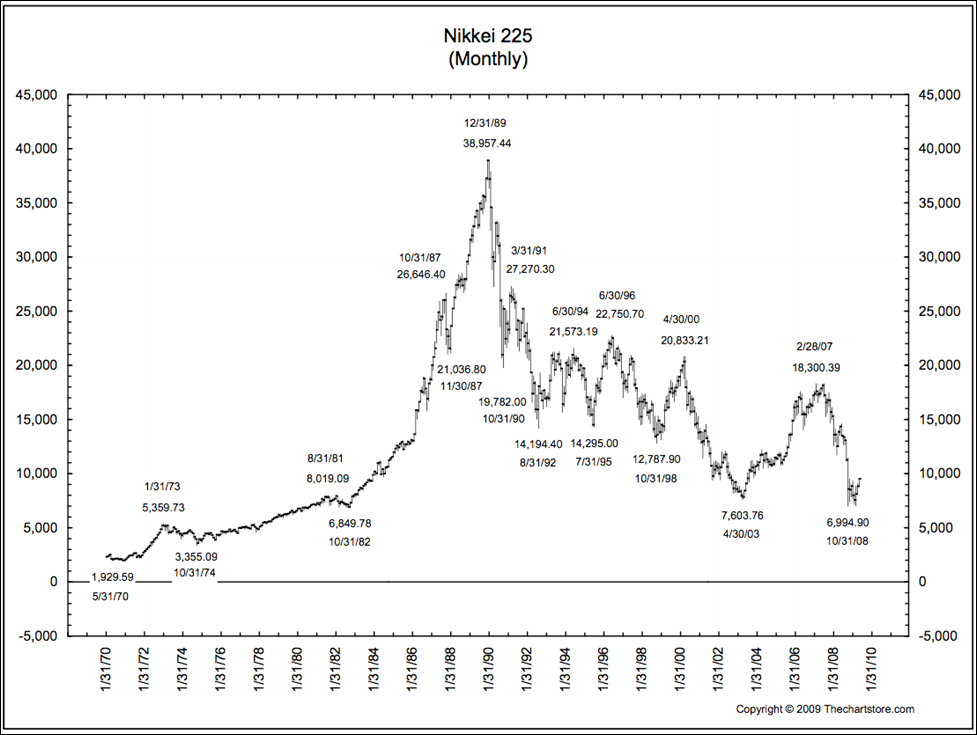
Not surprisingly, Jean-Marie and I both had vivid memories of the 1980s Japanese bubble as well, perhaps, I believe, because neither of us participated in that stubborn episode to any extent. At the time – as may be happening with China today — Japan was portrayed as an irrepressible force and the greatest economic threat to the United States, whereas economists and politicians were becoming increasingly aware of a hollowing out of US manufacturing and a widening bilateral trade deficit.
Experts and specialists found many reasons to rationalize the elevated prices of Japan’s stocks — from the more conservative quality of Japanese reported earnings to the very low interest rates already prevailing in that economy. Most of these arguments were legitimate but the ultimate bursting of the bubble was a stark reminder that, in the end, it is the prices you pay that count.
The bubble was multifaceted: land prices, according to Stephen S. Roach, a senior fellow at Yale University’s Jackson Institute of Global Affairs (May 27, 2019), had increased 5000% from 1956 to 1986 even though consumer prices had only doubled in that time: by 1990 the total value of the Japanese property market had reached roughly four times the real estate value of the entire United States. Even golf club memberships could fetch as high as the equivalent of $2 million in 2019 dollars.
Also overlooked was the fact that Japanese share prices had increased three times faster than corporate profits during the 1980s, as their Price-to-Earnings ratios were exploding on the upside. In 1989 the P/E ratio on the Nikkei reached 60x earnings but, rewarding the patience of those who had had the conviction to wait, the Japanese stock market lost roughly 80% of its value over the next decade.

Similar experiences followed in the late 1990s and early 2000s (the Internet bubble) and eventually in 2007-2008 (the subprime crisis, followed by the “Great Recession”, of which the consequences are still being worked out). Those episodes are recent enough that many of today’s market participants probably don’t need to be reminded of them here, but the story of speculative euphoria and its aftermath continues to “rhyme” over the cycles.
In a January 2019 white paper (“Is the U.S. Stock Market Bubble Bursting”, January 2019, GMO), GMO argues that bubbles are discernable not only by elevated valuations: “they are also about animal spirits captured in stories of euphoria” such as, for example, the recent enthusiasm for crypto-currencies, Big Data, Artificial Intelligence and (my addition) perceived “disruptors” of established industries. The reluctance of many market participants to libel the current environment as a bubble is due to the absence of market-wide euphoria because irrational exuberance is only visible and measurable in selected speculative pockets.
Backdrop: Paradigm Shifts
In the United States today, the employment rate is near a record while inflation seems to remain hibernating. Yet, digging a bit deeper below the surface, it feels like there are two distinct economies, with savers/investors enjoying a prosperity that mirrors the performance of the stock market or the quick access of new technologies to easy money, while salaried workers in traditional industries are having trouble navigating today’s economic schizophrenia. To a degree or another, similar trends seem to be affecting most other major economies.
When I look at today’s sometimes puzzling world economic order, I am reminded of the American Agricultural Revolution. Over 200 years ago, 90 percent of the U.S. population lived on farms and fed mostly themselves but today, just two percent of the population produces food not only to feed the country but also to be a major exporting sector. During that process, farming appeared to shrink in importance when measured by employment, but was really experiencing an extended surge in productivity, producing a 2018 trade surplus of $10.9 billion. Through the use of technology, each farmer is now able to feed 155 people, versus only 19 people in 1940.
Economic history is full of such periodic paradigm shifts, although few extended over such long periods as the agricultural revolution. In my experience, these shifts can render some of our traditional economic and financial statistics temporarily confusing or outright misleading.
In the mid-1980s, near the peak of the Japanese bubble, many experts were proclaiming the death of American manufacturing. This contrasted with what my team was observing on our visits to factory floors, with new disciplines such as just-in-time, cell-manufacturing and total-quality being actively taught and implemented. We became convinced that, instead of dying, American manufacturing was in fact being reborn. Interestingly, only the American Manufacturing Association and the Japanese Chamber of Commerce were interested in our theory and both invited me to speak to their constituencies.
Robert Kaplan, now Emeritus Professor of Leadership Development at the Harvard Business School, was one of the leading academics who helped us investigate this discrepancy further.
Traditional management accounting had been developed when materials and direct (manual) labor made up the bulk of industrial companies’ costs. Those were relatively easy to measure and the practice developed of allocating so-called “overhead” costs, such as marketing, R&D and administration, in the same proportions as those easily-allocated direct costs. But, as industrial activities became lighter, cost structures evolved: by the 1980s, for example, in the growing electronics industry, materials and direct labor no longer represented more than 10%-15% of total costs.
Prof. Kaplan commented that U.S. companies were still using a 19th-century accounting framework to measure their activities in the 20th and soon-to-come 21st centuries. This misallocation led to the wrong investment decisions at the corporate level and, in the aggregate, the wrong assessment of U.S. competitiveness.
A New Paradigm?
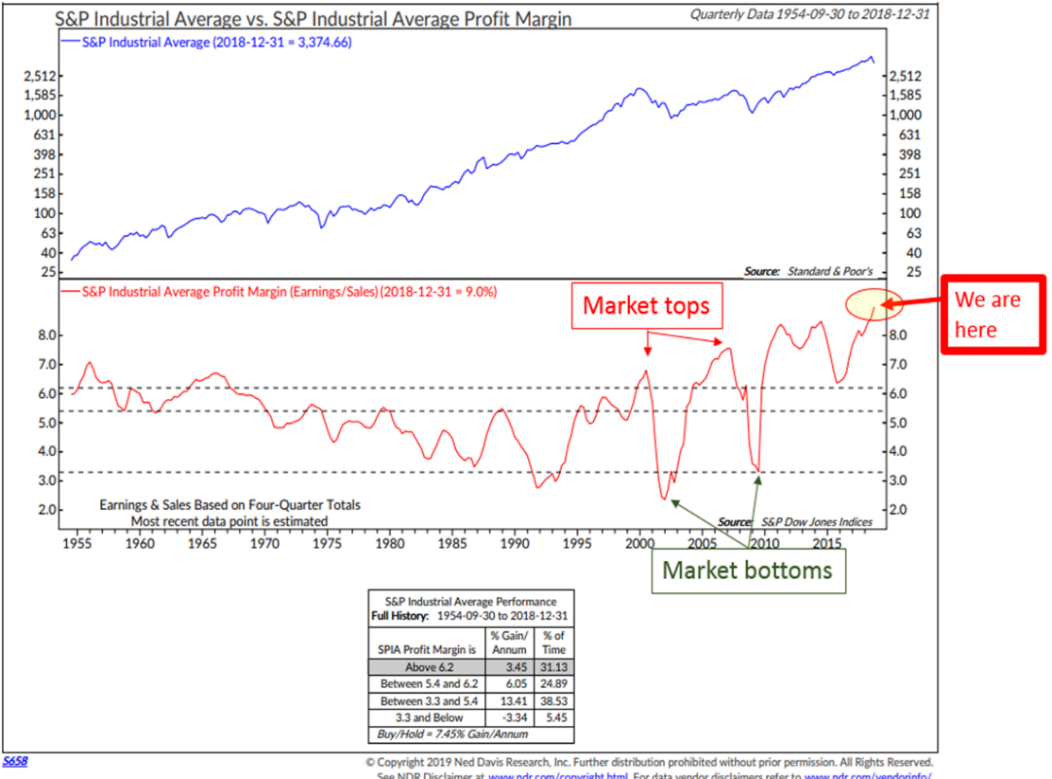
It is possible that we have entered another paradigm shift, with so-called “asset-light” companies taking the leadership of the economy and certainly of the financial markets, while activities such as heavier industry and even traditional brick-and-mortar retailing are struggling.
The new leaders often spend more on acquiring or creating intellectual property than on traditional assets and infrastructure. Moreover, as they often are so-called “disruptors”, who aim to replace traditional, formerly entrenched businesses, they are currently keener to quickly acquire significant market shares than on attaining traditional profitability levels. Their benchmarks, which they have convinced a majority of analysts to adopt, are sales revenues and growth, the number of users of their services, etc. These benchmarks tend to ignore or inflate reported earnings per share, such as the lack of significant investment depreciation, the dilution from executive options and other incentives and the boost to reported earnings per share from massive share buybacks on the stock market.

The impact of asset-light companies and their accounting on the S&P 500’s reported profit margins can be induced from the chart and table above. It seems doubtful that a continuation of recent advances can be caused by a further increase in profitability.
PRINCIPLES
One overwhelming principle that drives our investment philosophy is that you cannot predict the future, but you can prepare. What does this mean in practice?
Hyman Minsky and the Random Timing of Financial Crises and Recessions
Hyman Minsky was a professor of economics at Washington University in St. Louis, and a distinguished scholar at the Levy Economics Institute of Bard College but, until the subprime crisis and the ensuing Great Recession of 2007-2008, which brought him relative though posthumous fame, his writings had remained relatively confidential. Minsky’s Financial Instability Hypothesis was that financial crises (and the recessions that often accompany them) need not be triggered by outside events:
A fundamental characteristic of our economy, is that the financial system swings between robustness and fragility and these swings are an integral part of the process that generates business cycles. (September 15, 1974 — “Our Financial System is Fragile” — Ocala Star Banner)
In prosperous times, when corporate cash flow rises beyond what is needed to service debt, a speculative euphoria develops, and soon thereafter debts exceed what borrowers can pay off from their incoming revenues, which in turn produces a financial crisis. In the aftermath of such speculative borrowing bubbles, banks and lenders tighten credit availability, even to companies that can afford loans, and the economy subsequently contracts. This time of reckoning is sometimes labeled a “Minsky moment”.
If we cannot forecast the future, including the Minsky moments, how can we estimate future returns from the stock market? The answer is that we cannot predict the timing of Minsky moments but we can be assured of the ultimate outcome of these oscillations between stability and fragility.
Testing Minsky’s Hypothesis
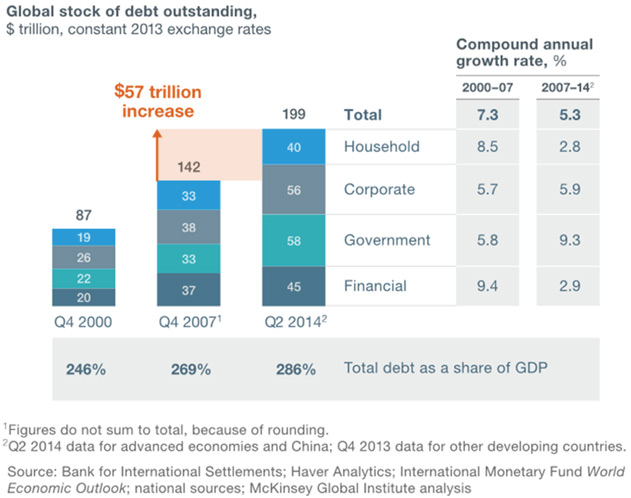
According to the McKinsey Global Institute (courtesy of Mauldin Economics’ Thoughts from The Frontline (6/8/2018):
From the Great Recession’s beginning through Q2 2014, global debt grew $57 trillion to $199 Trillion, including household, corporate, government, and financial debt. This sounds like the prelude to a Minsky Moment.

Throughout my career, I can’t remember any instances when global debt stopped growing durably, but there still has been a litany of warnings that the ratio of debt to GDP had reached unsustainable levels in various countries. For example, in A Decade of Debt, Carmen Reinhart and Kenneth Rogoff argued that public debts in the advanced economies have surged in recent years to levels not recorded since the end of World War II, surpassing the heights reached during the First World War and the Great Depression and that, historically, high leverage episodes have been associated with slower economic growth and a higher incidence of default or, more generally, restructuring of public and private debts. (National Bureau of Economic Research – 2/2011)
It is true that countries such as France, Japan, Finland, Sweden and the Netherlands have reached ratios of domestic debt to GDP well above the danger levels set by Reinhart and Rogoff without running into trouble. My conviction, however, based on observation of both human nature and crowd behavior, is that an increase of debt indicates that one has lived beyond their means and that, sooner or later, they will either have to go on a painful spending diet or go bust…
Liquidity and Negative Interest Rates
It used to be that a liquid entity meant one with ample reserves of cash or readily saleable (short-term) assets. In the 1980s and 1990s, as interest rates declined from record highs toward historical lows, debt became fashionable and liquidity increasingly was defined as the ability to borrow.
Supported by central bank policies, that trend accelerated after the recession of 2007-2008: today, there are around $13 trillion of bonds outstanding with negative yields — ones that do not pay you interest but, instead, where you have to pay for the privilege to invest. According to Bloomberg and Mark Grant, of B. Riley FBR Inc., some 40% of global bonds are now yielding less than 1%, including government and corporate bonds – some of them high-yield or “junk”.
This has two consequences:
– One is what was often referred to in the early 2000s as TINA (There Is No Alternative). With secure bonds yielding very little, most investors needing income or institutions faced with actuarial goals have no choice but to take more risks than usual.
– The other is a tremendous incentive to borrow to invest since your debt indebtedness carries little or no immediate cost.
The extent to which debt has become apparently painless is illustrated by the U.S. government. According to Treasury Direct, U.S. Government debt has grown a whopping 280% from less than $6 trillion to $22 trillion between 2000 to 2018. Thanks to steadily declining interest rates, however, the annual interest expense on that debt has only increased 44% from $362 billion to $523 billion in that same period.
Mauldin Economics points out (6/8/2018) that 60% of new corporate debt is in the form of new bank loans with maturities averaging only 2.1 years, at which point they will need to be refinanced. It also points out that many emerging market businesses and financial companies borrowed money in dollars to take advantage of the then relative weakness of the U.S. currency and its very low interest rates. For many, a stronger dollar and higher interest rates could prove lethal.
Among other, anecdotal signs of increased risk-taking, there already has been a sharp increase in corporate defaults among smaller, less-well capitalized, energy companies, especially some that were acquired by private equity funds, which often add debt to already rather leveraged companies.
Margin debt (buying stocks on credit) as a percentage of GDP has already exceeded its record levels reached at the market peaks of 2000 and 2008.
* * * *
Thus, the question today is not whether we will face a Minsky Moment, but when? That is a question we will try to investigate in PART II of this paper.
François Sicart
July 30, 2019
Disclosure:
This article is not intended to be a client‐specific suitability analysis or recommendation, an offer to participate in any investment, or a recommendation to buy, hold or sell securities. Do not use this report as the sole basis for investment decisions. Do not select an asset class or investment product based on performance alone. Consider all relevant information, including your existing portfolio, investment objectives, risk tolerance, liquidity needs and investment time horizon. This report is for general informational purposes only and is not intended to predict or guarantee the future performance of any individual security, market sector or the markets generally.

