Beyond The Headlines
EXPERIENCE, PRINCIPLES AND STRATEGY – PART II

Part I of this paper (July 30, 2019) concluded that conditions have gathered for a “Minsky Moment” (the time when apparent financial and economic stability turns into instability and eventually financial crisis or recession). The wait may be long for that precise moment to materialize, but since, as the saying goes, “trees don’t grow to the sky,” education and experience can give us a pretty good idea of the ultimate outcome. Thus, the main challenge lies in determining the likely timing of that moment, which is what we are going to investigate in this Part II.
I have not yet come across a model or formula allowing investors to predict stock market turning points with any accuracy. On the other hand, many studies by reputable analysts and research organizations are useful as backdrops to exercise one of our principles: “You cannot predict the future, but you can prepare.”
Understanding The P/E ratio
From its 2009 low of 677, the S&P 500 index has now gained more than 300%. Because earnings were temporarily suppressed by the Great Recession, it is difficult to compare gains in earnings and those of the stock market. But even using more “normal” dates such as July 1, 2007 (before the crash) and April 1,2019 (close to the recent high) the index progressed 90% while the S&P 500 earnings gained less than 30%. This is a useful reminder that big moves by the stock market are driven principally by changes in the Price/Earnings ratio (P/E), an indicator that is easy to understand and to monitor.
Two of the best researchers and writers about the stock market, John Mauldin and Ed Easterling, recently joined forces to write: “Valuation Determines Return” (in John Mauldin’s Thoughts from the Frontline, 3/15/2019)
One of the most useful graphics, from Easterling’s Crestmont Research, which keeps a wealth of economic and financial statistics, illustrates how the stock market “total return” is generated:
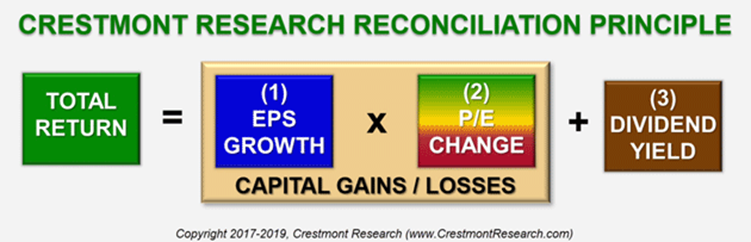
The authors further make the essential point that:
Over 10–20 years, the P/E [Price/Earnings ratio] can dramatically increase or decrease, resulting in a significant addition or reduction in total return. In the secular bear market of the 1960s and ’70s, the decline in P/E virtually eliminated the return from earnings growth and dividend yield. In the 1980s and ‘90s, the increase in P/E more than doubled the return for many of the decade-long periods during that secular bull market.
The Future Can Be Told…
In his March 8, 2019 newsletter “On My Radar”, Steve Blumenthal of Capital Management Group reviews many studies of what current equity market valuations can tell us about coming long-term returns (7 to 10 years or even 20 years, depending on the study). Morningstar does the same in the 2019 edition of its annual “Experts Forecast Long-Term Stock and Bond returns.”
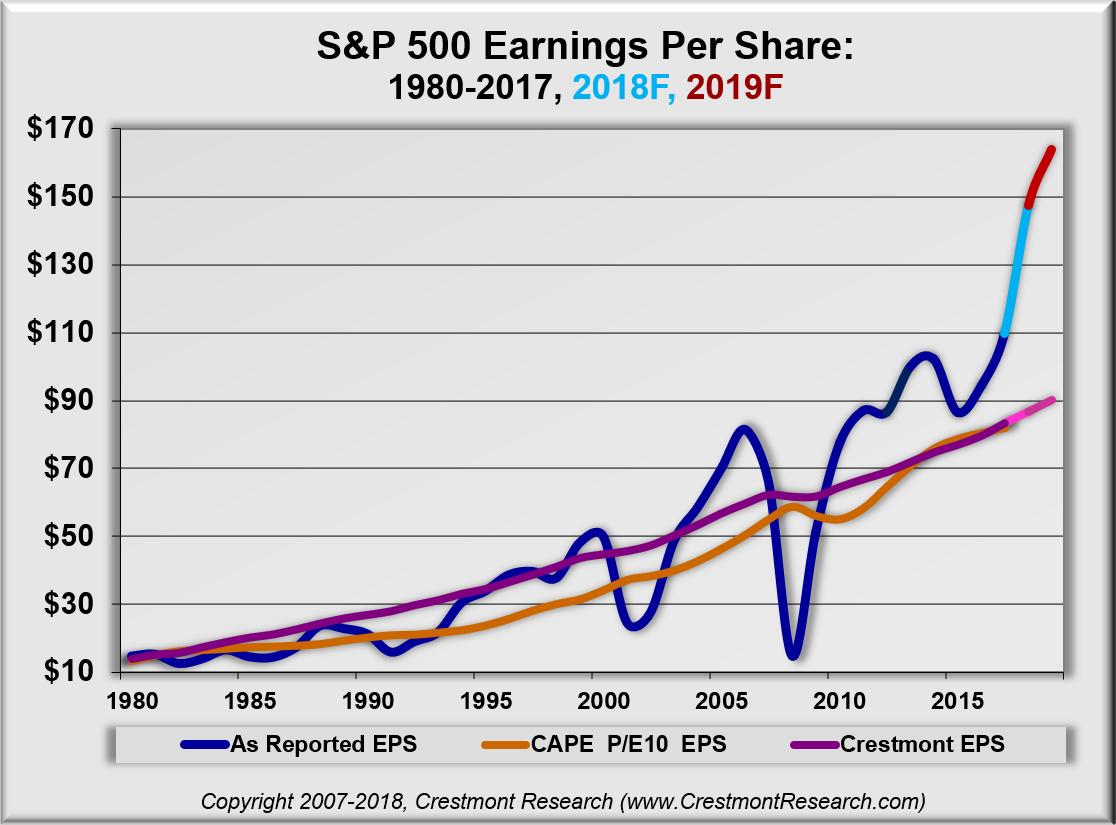
For most of these studies, valuation is measured by the current Price/Earnings ratio, although many use a moving average of earnings to calculate the P/E. This tends to understate the earnings (when previous years’ profits were lower) and to overstate the resulting adjusted P/E ratio; but it generally eliminates the effect on profits of most cyclical fluctuations. The following graph illustrates how Yale University’s Robert Shiller (CAPE P/E 10) and Crestmont Research, for example, smooth earnings to calculate their versions of the Price/Earnings ratio.
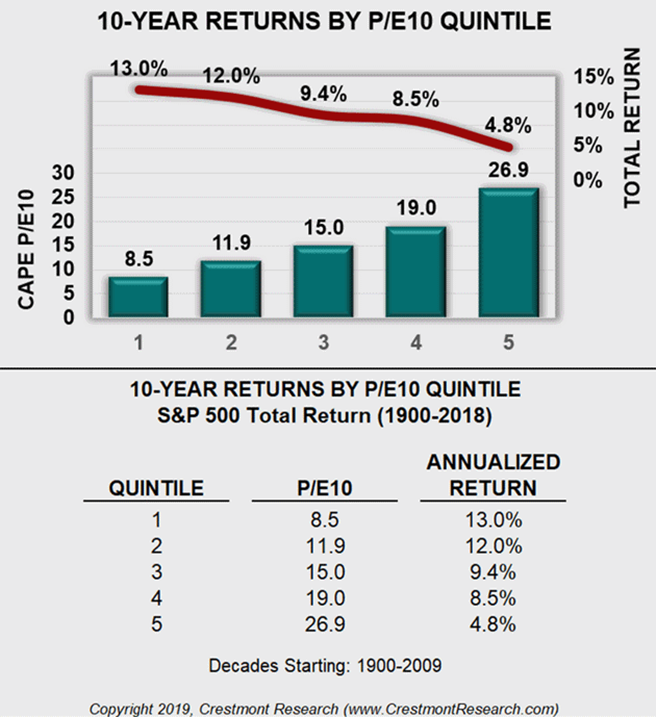
Using Shiller’s CAPE (Cyclically-Adjusted Price/Earnings ratio), Crestmont Research tallied 110 decade-long periods between 1900 and 2018 and grouped them by quintiles. The chart below shows how starting valuations strongly influence the S&P returns in the following 10 years. As the market’s starting valuations rise, future returns decline:
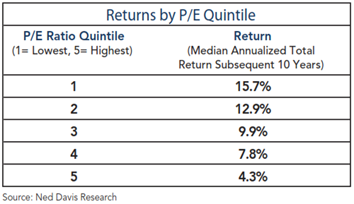
Ned Davis Research conducted a similar study using the stock market’s median P/E, e.g. the P/E with as many numbers above it as there are below. The median tends to be less influenced by extremes in a sample than the average, for example.
Using data from 1926 to 2014, median P/E was sorted into five quintiles. Quintile 1 is the lowest 20% of all month-end median P/Es and quintile 5 is the highest. In the following table, next to each quintile is the annualized nominal returns over the following 10 years.
The most important thing to remember from all these studies is that today’s valuation can give an excellent idea of the likely future stock market returns.
… But Not in Detail
The problem is that forecasting, for example, an 80% gain for the stock market over the coming 10 years (roughly equivalent to 6% per year) does not tell you when this performance might be achieved. For example, a two-year 56% gain could be followed by a 44% loss, then another gain and so on, with the ten-year net change totaling 80%.
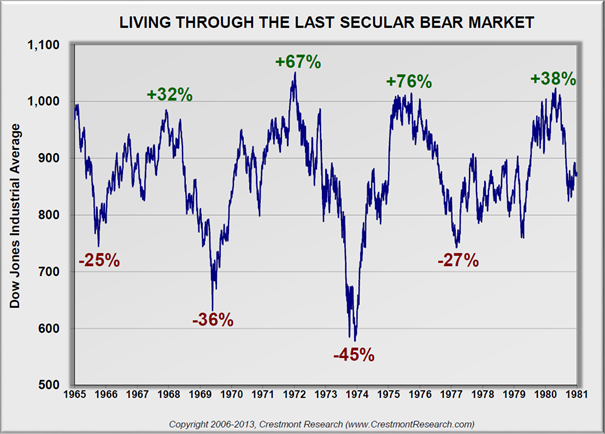
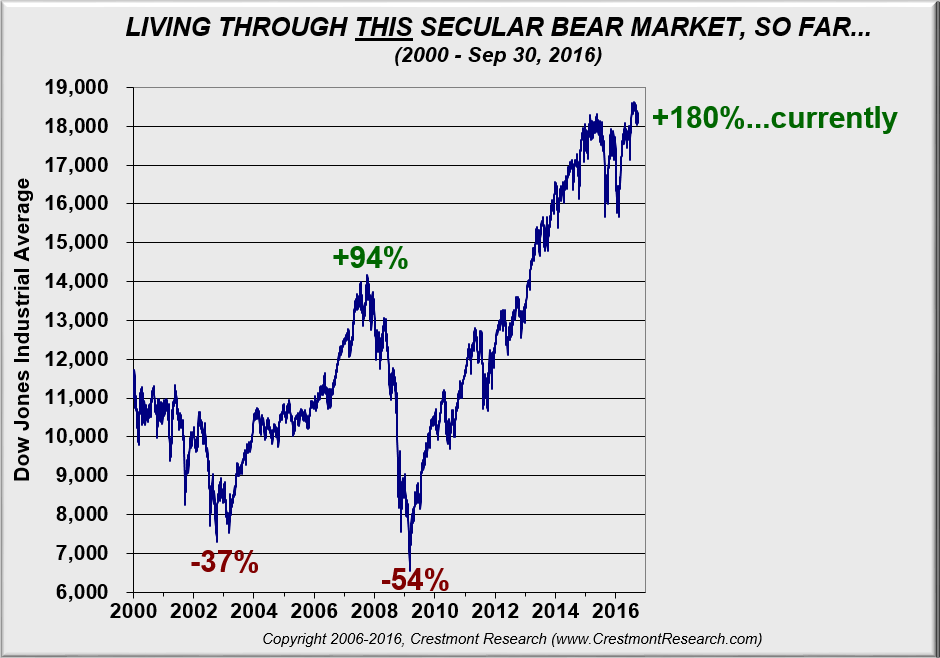
For those readers whose memories may have been numbed by the central bank-engineered, momentum-driven stock and bond markets of the last ten years, the following graphs from Crestmont Research (1965-1981 and 2000-2016) may remind them of what volatility feels like in real life:
Even Warren Buffett’s Berkshire Hathaway (presented here as a case study, not an investment recommendation) endured this kind of volatility which, of course, he viewed as opportunity.
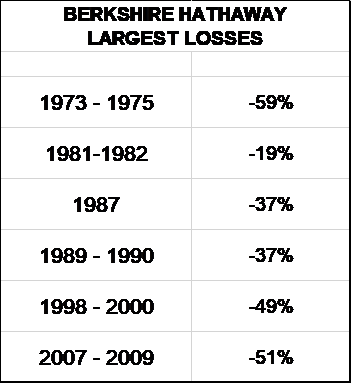
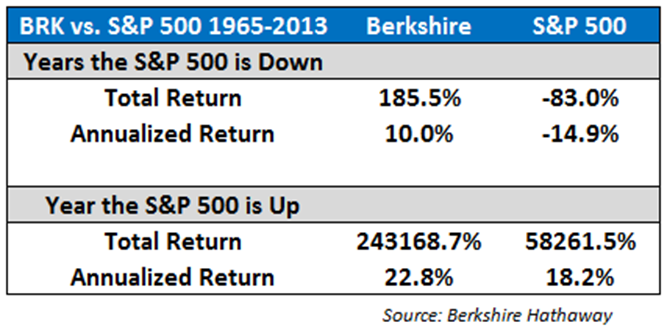
This, as can be seen below, did not hurt Buffett’s long-term record of building wealth. Yet his shareholders who did not have the courage or the patience to endure the volatility and sold Berkshire Hathaway during those episodes probably suffered the fate of the so-called “dumb money.” There is magic in having ready cash when opportunities arise.
Strategy
Value investors have traditionally been more focused on stock-picking than on macro analysis of the economy. But when my friend Jean-Marie Eveillard and I had lunch in July and were reminiscing about the financial crisis and Great Recession of 2007-2009, we concurred that it would have served us well to pay more attention to the macro environment.
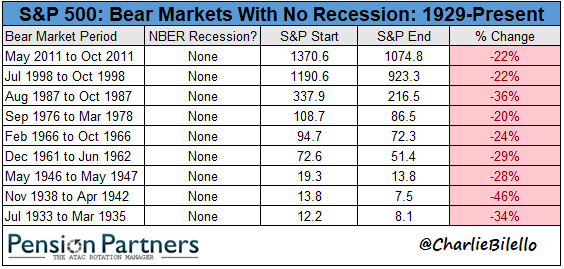
This conversation got me thinking and I reviewed the main stock market declines of the past few decades. I observed that the general difference between “corrections” and “bear markets” was that full bear markets tended to be accompanied by economic recessions and were often longer and deeper (30%-40% declines or more), whereas mere corrections, up to 20% declines, could be purely financial phenomena, not fundamentally affecting the country’s core economic activity.
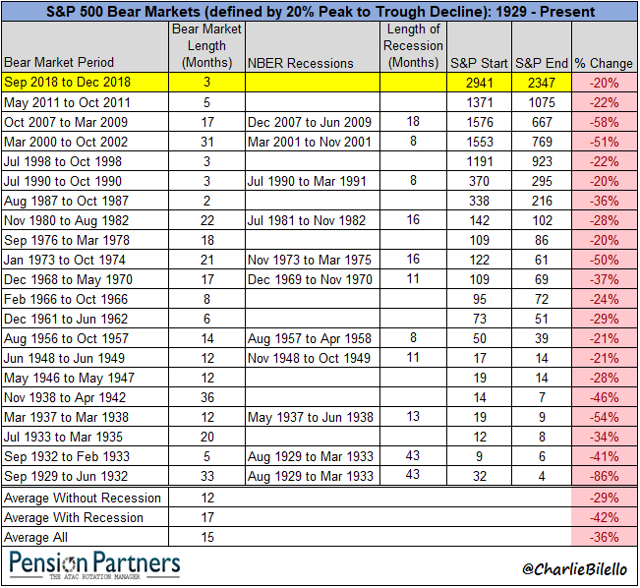
Source: Seeking Alpha – Dec. 26, 2018
Note: 1998 was in the midst of the Asian currency crisis and 1987, while traumatic, was a one-day stock market crash, too short to turn into a recession. Economic activity in 1962 felt the impact of a major strike.
* * *
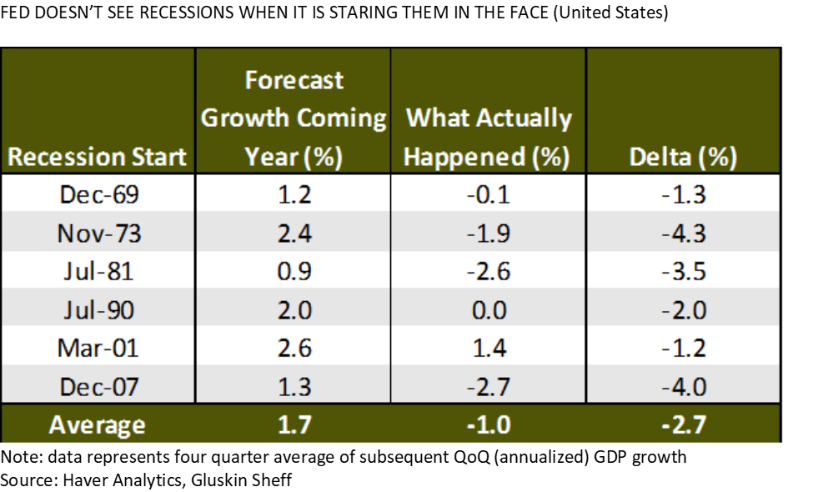
Nobel Laureate Paul Samuelson famously quipped that the stock market has predicted nine of the past five recessions. Indeed, whether they come from the private sector, academia, central banks or the International Monetary Fund, forecasts of economic activity have historically been inaccurate. Thus, we should view prediction of a possible recession and its timing with a grain of salt.
After remaining relatively sanguine about economic activity early in the year and even worrying about a re-awakening of inflation (prompting the adoption of higher interest-rate policies), a majority of economists has now been shifting to concern about a global recession, on the backdrop of weakening global economies and the trade wars initiated by the American government.
Of course, when both governments and central banks focus primarily on preventing stock market declines, as they have done recently, the distinction between financial crisis or bubble-bursting and economic recession may become moot. Economic policies may delay the pain, only to make it more acute later.
The Asian currency crisis of 1997 not only awakened my interest in Asia and particularly China, it also made me realize that the trigger of a financial crisis may be an apparently remote development (such as the devaluation of the Thai Bath) that is followed by a domino effect of other, bigger crises. The globalization of finance affects institutions and their clients in unpredictable places.
At the moment, among our worries are a large number of bonds and loans that are hover just above the “junk” label and which could be downgraded in coming months, especially if global economies continue to weaken. This development would prevent major pension funds and other large fiduciaries from holding these investments in their portfolios and could trigger a massive selling wave, putting into question these institutions’ liquidity. Somewhat related, for many corporations and governments outside the United States who borrowed in dollars, a continued appreciation of the U.S. currency may also mean the difference between apparent solvency and default. In addition, the ultimate effects of the current trade war, tariffs game, and now-threatened competitive or retaliatory currency devaluations are beginning to be felt in overall economic decisions and activity.
From our perspective, this is a good time to be prepared, for both the volatile environment ahead and the opportunities that it may create for investors with cash to invest.
François Sicart
August 12, 2019
Disclosure:
This article is not intended to be a client‐specific suitability analysis or recommendation, an offer to participate in any investment, or a recommendation to buy, hold or sell securities. Do not use this report as the sole basis for investment decisions. Do not select an asset class or investment product based on performance alone. Consider all relevant information, including your existing portfolio, investment objectives, risk tolerance, liquidity needs and investment time horizon. This report is for general informational purposes only and is not intended to predict or guarantee the future performance of any individual security, market sector or the markets generally.