Beyond The Headlines
HOLD THE CHAMPAGNE…
Until the Bubble has Burst

I was prompted to write this paper by a new book from Ben Carlson, author of the always-stimulating blog “A Wealth of Common Sense.” Reading his book Don’t Fall for It: A Short History of Financial Scams (Wiley, 2020) reminded me what I really always knew: speculative bubbles do not need fraudsters to happen. The victims can both create and succumb to the schemes all by themselves — out of ignorance or greed, and sometimes both.
The timing of the paper was also influenced by younger colleagues, several of whom recently asked me how previous bubbles, which they had not experienced directly, had felt in real life.
Over an investment career encompassing many bull and bear markets, I have witnessed only four (and a half) genuine bubbles and their aftermaths: The Nifty Fifty episode of the early 70s, the Japanese asset bubble of the late 80s, the Dot-Com bubble of the late 90s. the sub-prime lending bubble and crisis of 2007-2009, and the current “fleeing forward” of the tech sector which has not burst yet but, in my opinion, looks like a bug in search of a windshield.
The Go-Go Years and the Nifty Fifty
Although the stock market and the economy do not necessarily move in sync, the1960s enjoyed both an economic boom and a buoyant stock market. So much so, in fact, that a leading economist proclaimed that we had now “conquered the economic cycle”, implying that we would no longer suffer recessions. Right on cue, of course, a recession and stock market downturn hit the United States in 1969 and 1970, with the stock market shedding 35% of its value.
Bankers and money managers, shaken by the surprise loss, nevertheless noticed that fifty or so companies had continued to be profitable and to grow throughout the recession. As a result, these recession-resistant, “one-decision” stocks (which should theoretically be bought and never sold), became known as The Nifty Fifty. Major institutional investors began to concentrate their portfolios into those shares, whose valuations, measured by their Price-to-Earnings ratios (P/Es), rose stratospherically as a result, further helped by synergy-creating acquisitions and earnings-inflating “pooling-of-interest” accounting.
Of the Nifty Fifty stocks documented by Morgan Guaranty, the top dozen sported P/Es between 50- and 90-times earnings before the stock market (as measured by the S&P 500 index) lost 45% of its value between December 1972 and December 1974.
Quite a few of the Nifty Fifty survived and prospered over time, although usually after a multi-year lull. Among the institutional favorites, Avon Products dropped 86% from $140 to $19 between the end of 1972 and the end of 1974, while Coca-Cola lost 70% from $149 to $45. More generally, the majority of the Nifty Fifty underperformed the broader S&P 500 index for the next 29 years and even long-term survivors like Disney, Coca-Cola, Eli Lilly and Merck were still down after ten years.
On the other hand, such Nifty Fifty stars as Polaroid, Simplicity Pattern, Kresge (later Kmart), Burroughs and Eastman Kodak disappeared — or nearly so. (Sources: The Journal of Investing – Fall 2002 and a blog post by Jason Zweig with Malcolm Fitch – 12/11/2016)
Personally, I have pleasant memories of the Nifty Fifty episode for two reasons: first, value-type stocks did not lose as much in the decline as the previously-favored, “one-decision” shares; second, my mentor and partner Christian Humann had anticipated very early the return of inflation and had invested heavily in producers of natural resources and commodities, from oil to copper, gold and even sugar. All I had to do was to hold on to them. Even after the bubble burst and former favorites started declining, inflation hedges continued to rise with the accelerating inflation and the declining dollar.
All in all, I was lucky that my investment record started at a time of depressed prices for the stock market, and benefited from the first couple of years of the rebound, augmented by the good returns of the natural resources sectors. This taught me that the way to make money over time is, first to avoid periods when a few names are responsible for the momentum of the broad stock market indexes; and second, to possess cash to invest at market bottoms, when most investors are forced to sell – rules that I still follow.
The Japanese Asset Price Bubble
In the late 1980s, Japan’s swift money-supply growth and credit expansion resulted in grossly inflated real estate and stock market prices. In only six years between 1985 and 1991, commercial land prices in six major cities rose 302% while residential land gained 180%, while the Nikkei 225 stock market index tripled to a record 39,000 between 1985 and 1989 — after being briefly interrupted by New York’s Black Monday crash in 1987.
The yen also appreciated strongly against a weakening dollar after the Plaza Accord of 1985. The value of the dollar in yen was almost cut in half, from 260 in early 1985 to 139 by mid-1989. This allowed Japanese companies to spend huge sums to acquire trophy properties abroad. In the United States, such acquisitions included Firestone Tire, Columbia Pictures and Rockefeller Center in New York — which pretty much marked the top of the Japanese bubble.
I must say that the Japanese bubble of the 1980s left me essentially unscathed, since I had no investment in Japan at the time. My worst memories of that episode are from TV interviews where I was exposed to the irony of temporary “experts”, who explained that Japanese assets were not expensive in view of Japan’s much lower interest rates and its corporations’ generally more conservative accounting and reporting practices.
Yet, when I saw the Japanese shares’ valuation statistics and the prices Japanese buyers were paying to acquire American companies and properties, my convictions were strengthened rather than shaken.
As usual, it took some patience but by 2004, for example, the price of Tokyo’s homes was less than a tenth of its peak, and the Nikkei 225 stock index fell almost 80% from 39,000 in December 1989 to 8,000 in March 2003.
The Dot-Com Bubble
In a way, it is best to be contrarian when the “madness of crowds”, as Charles Mackay called it in 1841, becomes evident in the financial markets. Even so, ample patience is still required because, as John Maynard Keynes said, “the market can remain irrational longer than you can stay solvent”.
The late 1990s present a perfect example of this phenomenon. All reasonable valuation criteria were thrown to the wind for Internet-related companies. Companies could simply add “.com” to their name and watch their shares explode upward in the stock market. Even a hint of involvement in the Internet could create millions or billions of stock market wealth almost overnight. Between 1995 and its peak in March 2000, the NASDAQ Composite index, which included most of the Internet-related companies, rose 400%. The index’s price/earnings ratio reached 200x in 2000, more than twice that of the Nikkei 225 at the peak of the Japanese asset bubble in 1989.
In subsequent years, the dot-com stocks gave back all of their gains. Ben Carlson’s book, mentioned earlier, contains a table depicting the carnage:
Tech Stock Losses During the Dot-Com Crash
Amazon -95%
Apple -80%
Cisco -86%
Intel -78%
Oracle -83%
Microsoft -60%
Note that most of these companies have remained among the top technological leaders in the world to this day. Yet even the stock of Amazon.com, for example, did not reach its bubble high again until October 2009 – nine years later.
The memories of the bursting of the bubbles of the Nifty Fifty in the 1970s and the dotcoms in the 2000s remain vivid, even for those who were relatively unscathed.
My old friend and colleague Jean-Marie Eveillard, who was eventually inducted into the Morningstar Hall of Fame for his career achievements, lost many shareholders of his mutual fund during the bubble because, as a staunch value investor, he temporarily “underperformed” trendier managers. He famously stated in an interview: “I would rather lose some shareholders than lose my shareholders’ money”, a phrase of which I am envious. Not only did his fund continue to prosper, but it reached a record size in the few years after the dot.com craze.
The main teaching from the dot.com episode is that bubbles usually spring from valid observations and ideas. They only become bubbles when analysts and money managers with plentiful intelligence, knowledge and money (but no discernment or common sense) start justifying the prices fetched by trendy favorites, and promote them to investors without regard to valuation or potential limits to their success. As Warren Buffett famously stated: “Price is what you pay, value is what you get”.
There is a danger in buying at any price shares of companies that promise to change the world. I once wrote a paper comparing RCA in the 1920s to AOL in the 1990s. Radio did change the world and “disrupted” traditional and advertising media and RCA’s earnings and stock price exploded accordingly. The number of households with radio sets grew from 2.75 million in 1925 to 10.25 million in 1929 and, through the Great Depression, to 27.5 million in 1939.
But investors were wrong about RCA’s price. As we can see in the following chart, the fate of AOL’s stock was not different in the 1990s after its vogue during the early Internet boom.
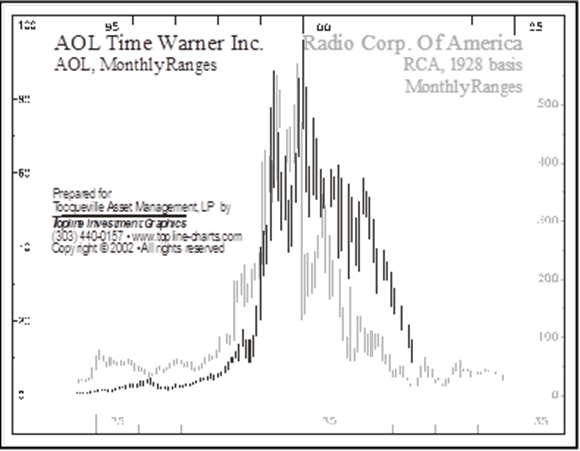
As Warren Buffett once said: “Price is what you pay, value is what you get”.
The Great Recession and the Fed “Put”
In late 1987, Federal Reserve Chairman Alan Greenspan invented a policy orientation then labeled the Greenspan “put”. A put is a stock market instrument which gives the holder the option to sell a security at a given price in the future. Investors typically use that option to protect themselves against a decline in the price of the security, thus reducing the risk of their investments.
After subsequent Fed chairs adopted a similar policies, the “Greenspan put” simply became known as “the Fed Put”. This is important, because the new asymmetry of monetary policy explains the length and severity of subsequent bubbles.
Greenspan and his successors became convinced that financial market turmoil was a sign of looming economic recessions, and proceeded to implement aggressive monetary easing at the first sign of stock market weakness. This tended to cut short bear markets in stocks and often postponed economic recessions – for a while. But it also failed to fully correct speculative excesses, setting up the stage for future crises..
After the “Sub-Prime” financial crisis of 2007-2009 and its resulting “Great Recession” engulfed the United States, a relatively unknown professor of economics named Hyman Minsky was re-discovered. Minsky had hypothesized that financial crises and recessions did not require a trigger: they were inherent to the free market system and long periods of financial and economic stability were naturally destabilizing over time. Stability made people feel more adventurous, and prone to risk-taking (usually by undertaking more debt) until too much became too much and the speculative bubble burst.
I always felt that Minsky’s lack of renown (in spite of the intuitive logic of his “hypothesis”) resulted from his blaming the economic cycle on the very nature of free markets. In a way it reeked of Marxism, which was of course very unpopular on Wall Street. Personally, I never felt that Minsky was particularly left-wing, and his views have now become more mainstream, with the development of behavioral finance recognized by a few Nobel Prizes in recent years. The experience of recent bubbles has also tended to reinforce Minsky’s ideas.
In the years leading up to 2007, increasingly easy monetary policy led to historically-low mortgage interest rates and loosening bank-lending criteria: borrowers lied about their financial situations and bankers failed to verify their information or, sometimes, even encouraged them to lie.
The following paragraphs, extracted from Wikipedia, provide a brief but sufficient description of the domino effects of the crisis and recession:
“Excessive risk-taking by banks… combined with the bursting of the United States housing bubble caused the values of securities tied to U.S. real estate to plummet, damaging financial institutions globally, culminating with the bankruptcy of Lehman Brothers on September 15, 2008, and an international banking crisis. The crisis sparked the Great Recession, which, at the time, was the most severe global recession since the Great Depression. It was also followed by the European debt crisis…
“U.S. home mortgage debt relative to GDP increased from an average of 46% during the 1990s to 73% during 2008… The increase in cash-out refinancing, as home values rose, fueled an increase in consumption that could no longer be sustained when home prices declined. Many financial institutions owned investments whose value was based on home mortgages such as mortgage-backed securities, or credit derivatives used to insure them against failure, which declined in value significantly. The International Monetary Fund estimated that large U.S. and European banks lost more than $1 trillion on toxic assets and from bad loans from January 2007 to September 2009.”
From October 9, 2007 to March 9, 2009 the S&P 500 lost approximately 50% of its value. Severe setbacks were also experienced by other world stock markets and the economic recession spread to foreign countries as well. It could be argued that the recession lasted until 2016 and some of its effects even longer, but the duration of the bear stock market was shortened by aggressive monetary policy (“quantitative easing”) from the Federal Reserve board, all the way to near-zero or even negative interest rates.
Still, a fellow value manager later reflected that, in 2006-2007, rather than focusing only on stocks’ valuations, “we probably should have paid more attention to the macro economy”.
The Era of TINA, FAANGS, NASDAQ and FOMO
More than 10 years after the Financial Crisis and Great Recession, and after the longest statistical recovery in recent history, unemployment remains stubborn and many businesses are weakened by heavy debt burdens. These trends have recently been aggravated by the Covid-19 pandemic, and the efforts of governments and central banks have mobilized unheard-of fiscal and monetary resources to prevent their economies from falling back into recession.
But it is hard to stimulate economies when many consumers are unemployed, general uncertainty prevents many businesses from investing, and governments realize that their current stimulative efforts will burden their budgets for years or maybe decades to come.
In recent times, the main responsibility for supporting weak economies has rested with central banks. The usual reaction has been to lower interest rates, which fell toward zero or, in some countries, lower. With bond interest also hovering at the same level, savers and retirement or insurance funds could only invest in the stock market or real estate, both of which have been in a price uptrend for more than a decade.
This is why TINA (“There Is No Alternative”) and the old adage “don’t fight the Fed” have become popular themes in recent years. With many traditional, mature industries still reeling from the recession and lukewarm recoveries, a large proportion of investing money flowed to shares of companies expected to grow faster, in technology-related activities. Since many of these companies such as the FANMAG (Facebook, Amazon, Netflix, Microsoft, Apple, Google) are listed on the NASDAQ, this group outperformed older and more diversified indexes by a wide margin.
As had been the case with previous bubbles, investors and advisers who often have more smarts than common sense formulated and promoted the rationale for holding these stocks above all others. Under their influence and the “evidence” of the tech sector outperformance in the stock market, much of the investing crowd succumbed to FOMO (Fear Of Missing Out) and added to the demand for this relatively small sample of companies.
In this respect, the following chart, from Ned Davis Research (www.ndr.com) courtesy of Steve Blumenthal’s blog, is strikingly self-explanatory.
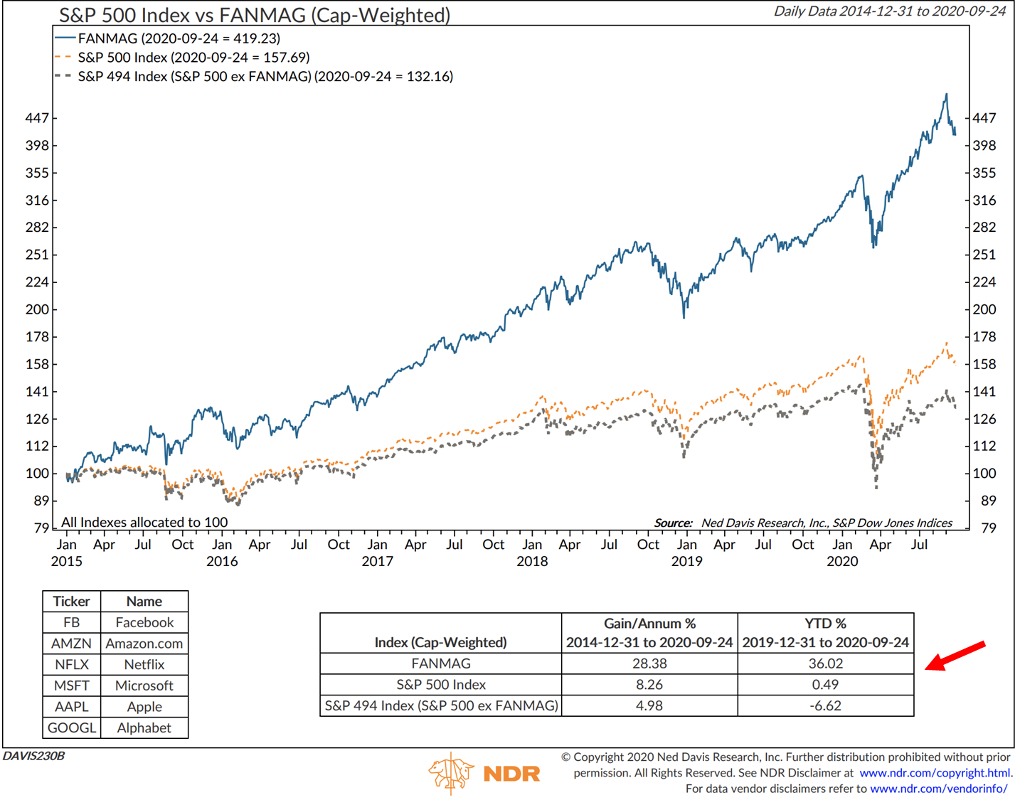
As can be seen, the FANMAG stocks have gained over 30% this year to-date, while the other 494 stocks in the S&P 500 index have lost almost 7%.
As I conclude this brief overview of my experience with investment bubbles, I wonder what some of the great entrepreneurs of history, who painstakingly built their iconic fortunes, would think of today’s wave of financial “unicorns”. In today’s stock market parlance, a unicorn is a privately held startup company valued at over $1 billion. Thanks to the huge overflow of central-bank-provided liquidity into the stock market, many of these startup or near-startup companies raise phantasmagoric amounts of capital through Initial Public Offerings (IPOs) before producing even a dime of profit.
TESLA, founded in 2003 by visionary Elon Musk, has yet to make a profit according to some of the best financial analysts, if one excludes revenues from selling to customers and competitors the carbon credits granted by the government to “green” companies. Yet, TESLA is valued by the stock market at $380 billion!
In the words of my early mentor Walter Mewing, “As long as a company makes no money, its shares can go up indefinitely, because they sell on hope. But when they start earning a measurable profit, BEWARE, because you will now have to deal with data.” A word to the wise…
François Sicart – September 30th, 2020
Disclosure:
The information provided in this article represents the opinions of Sicart Associates, LLC (“Sicart”) and is expressed as of the date hereof and is subject to change. Sicart assumes no obligation to update or otherwise revise our opinions or this article. The observations and views expressed herein may be changed by Sicart at any time without notice.
This article is not intended to be a client‐specific suitability analysis or recommendation, an offer to participate in any investment, or a recommendation to buy, hold or sell securities. Do not use this report as the sole basis for investment decisions. Do not select an asset class or investment product based on performance alone. Consider all relevant information, including your existing portfolio, investment objectives, risk tolerance, liquidity needs and investment time horizon. This report is for general informational purposes only and is not intended to predict or guarantee the future performance of any individual security, market sector or the markets generally.