Beyond The Headlines
It’s easier to find someone to blame after the losses than to prepare for adversity
Fiduciaries’ Time Horizons Can Be Dangerous for Multi-Generational Patrimonies

“Shirtsleeves to shirtsleeves in three generations.” United States
“Clogs to clogs is only three generations.” England
“Rice paddies to rice paddies in three generations.” Japan
“The father buys, the son builds, the grandchild sells, and his son begs.” Scotland
“Wealth never survives three generations.” China
The universality of the proverb above is the reason why, as investment advisers and family office to several generations, we view it as one of our primary missions to help our client families avoid the “curse of inherited wealth”. A good place to start is to try and avoid speculative bubbles and their fortune-destroying aftermaths.
* * * *
The history of investment markets is punctuated by the building and bursting of speculative bubbles, often accompanied or followed by economic recessions. Avoiding these dangerous periods should be a major goal of investment for the long-term growth and protection of family patrimonies. In spite of this, after hundreds of years of experience, eliminating the impact of bubbles from truly long-term investment performance remains more an art than a science.
Venture capitalist Morgan Housel recently remarked that, because we do not know exactly when and how asset bubbles build up, our commentaries usually take refuge in the comfort of blaming others, such as the Fed, banks or Congress:
“Bubbles’ outcome is known in hindsight but the cause and blame are never settled on and in hindsight we are more apt to blame than learn”. (1)
Contradicting this natural tendency to blame, one of the originalities of Hyman Minsky’s Financial Instability Hypothesis was to state that “the financial system naturally swings between robustness and fragility and these swings are an integral part of the process that generates business cycles.” The booms and busts that tend to accompany these swings are thus inevitable in a so-called free-market economy and do not need an external trigger, such as policy error, natural disaster or war, to occur. (2) So. Where should we watch for potential bubbles?
Is Valuation an Anchor?
Many investors accept that bubbles are primarily a psychological phenomenon and thus a product of the “madness of crowds”. (2)
In recent years, this view has been reinforced by work from a newly-popular branch of psychology, behavioral investing, whose researchers hope, one day, to develop precise indicators of irrational excesses of greed or fear that would tell us when to buy or to sell financial assets. Unfortunately, those kinds of signals are anything but precise. The professionals’ favorite tool to detect bubbles probably remains valuation, of which one of the simplest and most widely used form is the price/earnings ratio (P/E).
Two groups have contributed to the upward pressure on stock prices and thus P/E ratios.
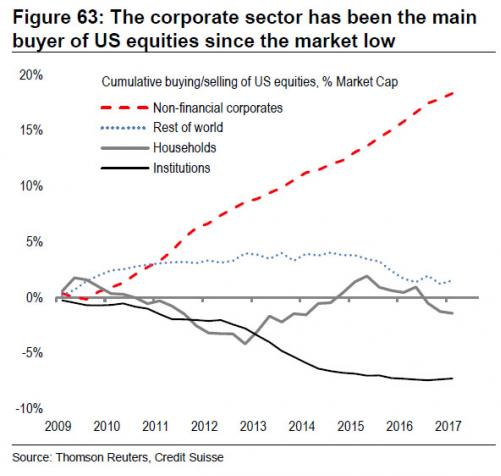
Corporations buying back their own shares boost earnings and lower P/E ratios
By buying in their own shares on the stock market, companies reduce shares outstanding and thus boost reported earnings per share, though at the expense of increased balance sheet leverage (equity and cash shrink, while debt does not), so that there is a limit to this trend.
As can be seen on the following graph, corporations have been the most aggressive buyers of their own shares since the stock market low in 2009.
As If Life Was Not Complicated Enough, Central Banks Enter the Stock Markets
Much discussed, as a reason for high P/E ratios on stocks, is the artificially-low level of interest rates engineered by the world’s leading central banks. Stocks compete with bonds for investors’ favor, so when interest rates are low, P/E ratios tend to be high. And when interest rates are very low…
But, as if ultra-low interest rate policies were not enough, central banks now have begun to aggressively acquire common stocks directly.
In April, Bank of America noted that central banks around the world had already purchased $1 trillion in assets to that point of the year (an annualized rate of $3.6 trillion) and said it was the “best explanation” for record-high stocks. (3)
The Swiss central bank bought $80 billion worth of U.S. stocks through the end of the first quarter 29% more than at the end of last year. (4)
The Bank of Japan is now among the five largest owners in 81 companies on the Japan Nikkei 225 index… and nearly the primary owner in 50 of them. (5)
A recent Invesco poll of currency reserve managers at central banks revealed that 80% of the 18 central banks polled plan to increase their stock holdings. (6)
Creating the Illusion of Perpetual Motion with a Minority of Stocks
When dealing with stock market indexes rather than with individual securities, the weighing of the stocks making up the index may also hide the fact that “bubbles” are concentrated in some segment of the market. As such, they may not necessarily show up in statistics for “the market” at large. Or, on the contrary, they may artificially boost these statistics. For example:
Goldman Sachs points out that 55% of the Nasdaq’s gains this year (to June 7) have been due to the top 5 large-cap tech stocks: Apple, Google, Amazon, Facebook and Microsoft. (7)
Bloomberg (08-04-2017) reports that large-capitalization stocks have risen six times as fast as smaller companies in the Russell 2000 Index. The advance in mid-size companies is about half the S&P 500.
At the same time, the large positions occupied in leading stock market indexes by recent top performers mean that, as index-mimicking funds attract capital, they have to buy large amounts of these stocks, further fueling their rise. Howard Marks observes in his July letter:
“In the current up-cycle, over-weighted, liquid, large-cap stocks have benefitted from forced buying on the part of passive vehicles, which don’t have the option to refrain from buying a stock just because it’s overpriced.
Like the tech stocks in 2000, this seeming perpetual motion machine is unlikely to work forever. If funds ever flow out of equities and thus exchange-traded funds (ETFs), what has been disproportionately bought will have to be disproportionately sold. It’s not clear where index funds and ETFs will find buyers for their over-weighted, highly appreciated holdings if they have to sell in a crunch.” (9)
Historical Background and Necessary Flashbacks
Valuation measures may not be ideal timing indicators, but when one compares the price of a stock or of an index to a single figure like its last twelve months’ earnings, there is no escaping the logic that the higher the ratio, the more optimistic investors are.
This is why an index’s P/E ratio materially exceeds its historical norm, there must be a strong presumption of a bubble in formation. In his July 26 letter, Oaktree’s Howard Marks points out that “the S&P 500 is selling at 25 times trailing-twelve-month earnings, compared to a long-term median of 15. The Shiller cyclically-adjusted PE ratio stands at almost 30 versus a historic median of 16. This multiple was exceeded only in 1929 and 2000 – both clearly bubbles”. (9)
In early August, David Stockman calculated that Facebook, Amazon, Google, Netflix, Apple and Microsoft saw their weighted average P/E increase by 50% over the previous 30 months. He recalled the Internet bubble when, at the March 2000 peak, Microsoft’s P/E was 50x, Intel’s was 60x and Cisco’s was 200x: this compares to Facebook’s 40x, Amazon’s 190x and Netflix’s 217x today. Two years later, he reminds us, the four tech giants of the Internet bubble had lost 75% of their value. (10)
Amazon’s 1997 letter to shareholders states: “We established long-term relationships with many important strategic partners, including America Online, Yahoo!, Excite, Netscape, GeoCities, AltaVista, @Home, and Prodigy”.
“Unless you believe Yahoo remains a leading force in that space, none of these “important strategic partners” still exist in a meaningful way today. The super-stocks that lead a bull market inevitably become priced for perfection. And in many cases the companies’ perfection turns out eventually to be either illusory or ephemeral. Some of the “can’t lose” companies of the Nifty-Fifty were ultimately crippled by massive changes in their markets, including Kodak, Polaroid, Xerox, Sears and Simplicity Pattern. Not only did the perfection that investors had paid for evaporate, but even the successful companies’ stock prices reverted to more-normal valuation multiples, resulting in sub-par equity returns. (9)
A Bubble in Complacency
Basically, Minsky’s Financial Instability Hypothesis says that economic stability naturally breeds instability. But it helps to have a fertile soil and, there, debt and borrowing can help:
- When an economy is perceived as stable, people become optimistic.
- When people get optimistic, they pile on debt in an effort to increase their returns.
- When they pile on debt, the economy becomes unstable.
Thus, debt plays a central role in the bubble-building process and, from this vantage point, there is reason to worry when the economy appears stable and borrowing becomes overly easy:
In early May, Netflix issued €1.3 billion of Eurobonds, the lowest-cost debt it ever issued. The interest rate was 3.625%, the covenants were few, and the rating was single-B. Netflix’s GAAP earnings run about $200 million per quarter, but according to Grant’s Interest Rate Observer, in the year that ended March 31, Netflix burned through $1.8 billion of free cash flow. According to Howard Marks, “The fact that deals like this can get done easily should tell you something about today’s market climate”. (9)
He goes on to quote a comment from a leading strategist about the return of Argentina to the bond market after five defaults in the last hundred years (one in the last five): “It’s just shocking that they exit default and their bond issue is a century bond”. Nevertheless, the strategist was advising her clients to buy the bonds “at least for a short-term trade”.
Shifting Time Horizons May Explain Bubbles
In his blog article on bubbles, Morgan Housel adds a dimension to the definition of bubbles by bringing into the discussion the time horizons of various investors.
“One of the biggest flaws to come out of academic finance is the idea that assets have one rational price in a world where investors have different goals and time horizons… When investors have different goals and time horizons, prices that look ridiculous for one person make sense to another, because the factors worth paying attention to are totally different”. (1)
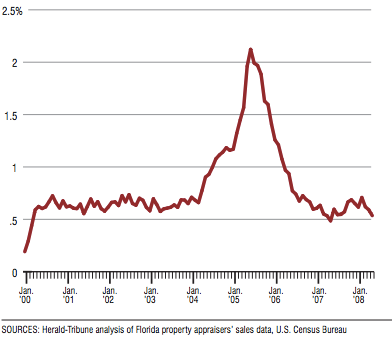
Since bubbles are bubbles, Housel’s comments on shifting time horizons apply to the housing market as well:
The following chart shows the percentage of Florida home sales whose previous owner held the property for less than six months. “It’s hard to justify paying $700,000 for a two-bedroom Miami track home to raise your family in for the next 20 years. But it makes perfect sense if you plan on flipping it in a few months into a liquid market with price momentum… You can say a lot about these investors. You can call them speculators. You can call them irresponsible. You can shake your head at their willingness to take huge risks. But I don’t think you can call all of them irrational.
Bubbles are not so much about valuations rising. They are about time horizons shrinking. They aren’t so much about people irrationally practicing long-term investing. They’re about people somewhat rationally moving toward short-term trading to capture momentum that had been feeding on itself. (1)
Conclusion
Successful long-term investing is primarily about understanding your own time horizon and not being persuaded by the price actions caused by people with different time horizons.
I believe that, by being drawn by consultants and new regulations toward the measurement of short-term “competitive” performance (e.g. performance relative to specific indexes or narrowly-defined competitors), many fiduciaries have been losing track of their long-term responsibilities to family fortunes.
As Warren Buffett may have said: “To finish first, first you need to finish.” And to finish, you must first avoid succumbing to speculative bubbles.
François Sicart
September 11, 2017
Notes:
- Morgan Housel – The Collaborative Fund blog – 6/22/2017
- The Jerome Levy Economics Institute of Bard College – May 1992
- Charles Mackay – Extraordinary Popular Delusions and the Madness of Crowds (1841).
- Business Insider – April 21, 2017
- Forbes – May 16, 2017
- Bloomberg.com – August 14, 2017
- The Daily Reckoning, July 19, 2017
- Zero Hedge – June 9, 2017
- Bloomberg.com – 08-04-2017
- “There They Go Again . . . Again” – Howard Marks – Oaktree, July 26(The Daily Reckoning – 8/1/2017)
- The Daily Reckoning – 8/1/2017
Disclosure:
This article is not intended to be a client‐specific suitability analysis or recommendation, an offer to participate in any investment, or a recommendation to buy, hold or sell securities. Do not use this report as the sole basis for investment decisions. Do not select an asset class or investment product based on performance alone. Consider all relevant information, including your existing portfolio, investment objectives, risk tolerance, liquidity needs and investment time horizon. This report is for general informational purposes only and is not intended to predict or guarantee the future performance of any individual security, market sector or the markets generally.