Beyond The Headlines
Reflections on the Shape of Stock Market Bottoms
Revisiting the V, W, and U Patterns

Bob Farrell, the iconic one-time investment strategist at Merrill Lynch, formulated Ten Basic Rules of Investing, which have since become a “must” reference for students of the stock market. One of these pronouncements stated that “Exponential rapidly rising or falling markets usually go further than you think, but they do not correct by going sideways.”
Recently I resolved to test this observation against my recollection of stock market bottoms I have personally experienced. My partner Bogumil Baranowski, more digitally adept than I, helped with the images in this article. It turns out that while Farrell’s rules constitute a useful warning, they cannot really help anticipate the exact shape of bottoms. Here are a few examples that stick in my mind…
[Please note that, for graphic quality, we have charted weekly prices. This eliminates the drama of the last few days of a bottom, which can be more prominent, especially when declines end in selling climaxes.]
1969-1970: Recession as a Surprise
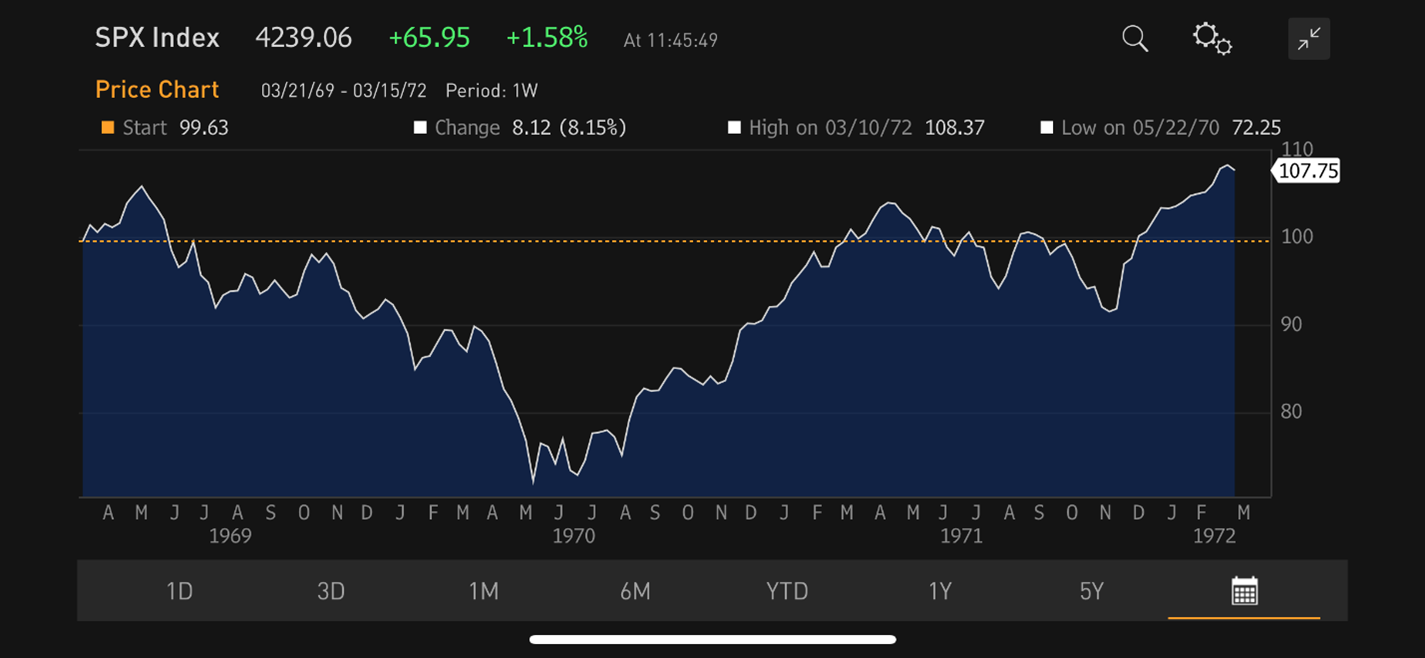
Source: Bloomberg.
The economic recession of 1970 was relatively mild and affected mostly the domestic sectors of the economy. Still, the stock market reacted rather emotionally, coming as it did after the “roaring 1960s” and at a time when economists and politicians had begun to believe that we had conquered the economic cycle. The V-shaped stock market bottom was relatively clean and responded well to traditional stimuli. The S&P 500 Index recovered to its 1969 high about one and a half years later.
1972-1974: The Double-Bottom Stock Market
This was my first hands-on experience of a bubble blowing up and then bursting. A small number of large, successful companies had weathered the 1970 recession quite well. Many were diversified internationally and exhibited growth characteristics that seemed independent of the traditional U.S. economic cycle. They wound up being labeled the “Nifty Fifty” and were heavily promoted by banks’ wealth departments as one-decision, recession-resistant stocks that investors would never need to sell. As expected, their valuations in terms of price/earnings (P/E) ratios skyrocketed but in time the bubble burst, as they always do. It took the S&P 500 more than four years to match its 1972 high, while several of the Nifty Fifty stocks took much longer to recover. Some never did.
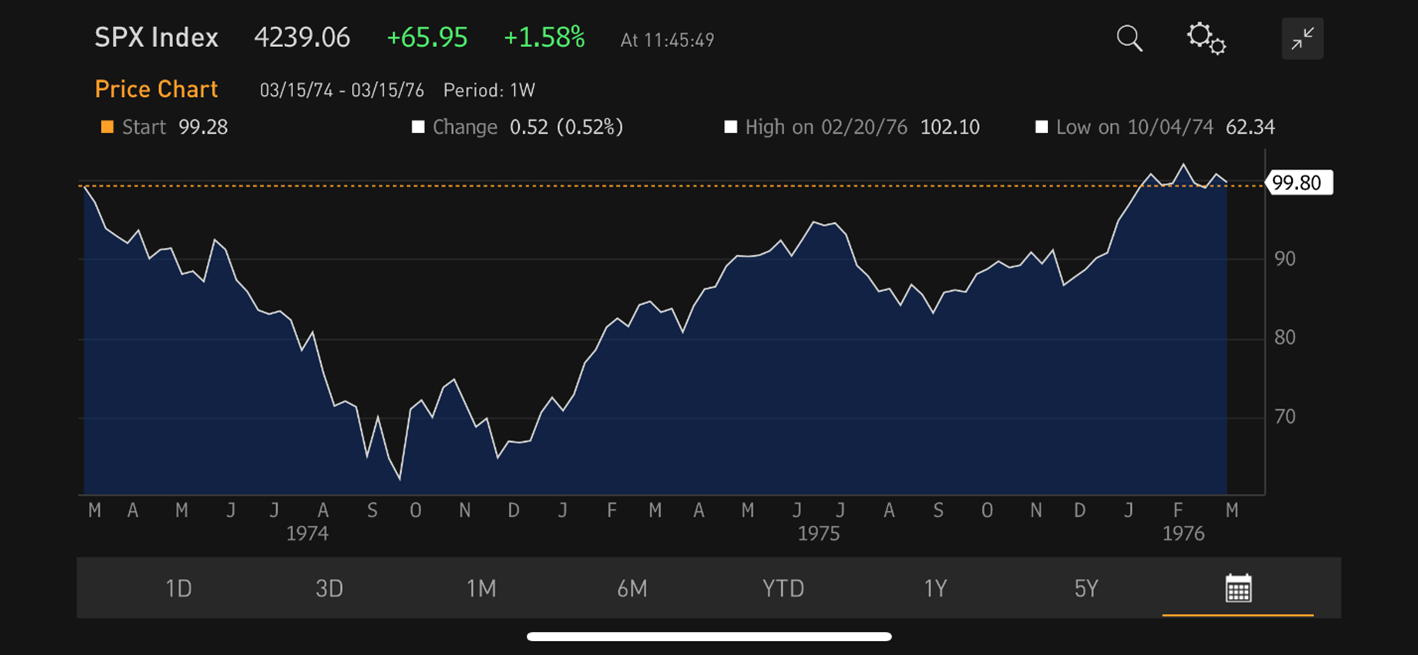
Source: Bloomberg.
After a major adjustment to much lower valuations, the market touched a double bottom in the following September and December. Even the stocks which had not participated in the bubble eventually reached record-low P/E ratios. Meanwhile, the materials-related companies that had been boosted by the first whiff of inflation also came back to earth (together with their earnings) as a result of the subsequent global economic recession.
1980-1982: One Long Recession, but in Two Acts
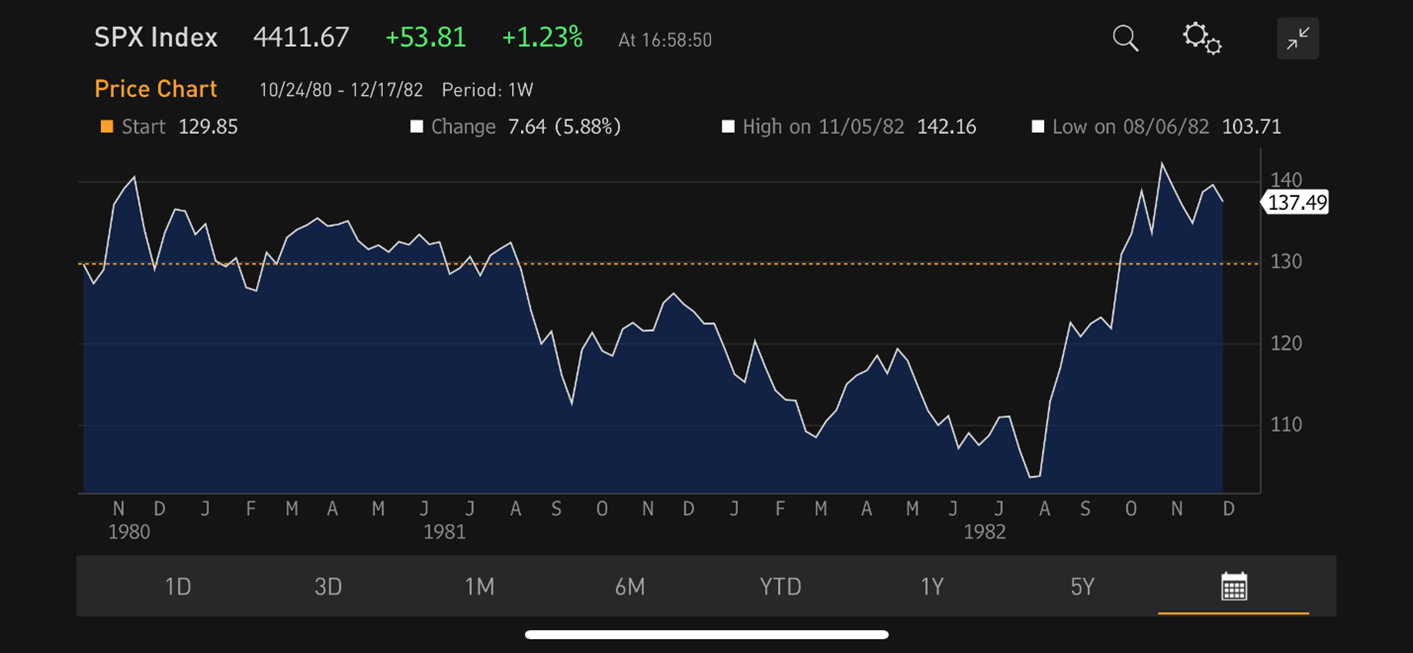
Source: Bloomberg.
By 1980, inflation had become a growing concern, and early, timid efforts to tame it had threatened to cause a fairly typical but still-mild recession. But in 1979, two situations had occurred that would exacerbate these tendencies. First came the fall of the Shah of Iran, a major oil producer. That incident triggered the second oil shock in recent memory, following upon the 1960 creation of OPEC, and Paul Volcker’s nomination to the chairmanship of the Federal Reserve. Volcker undertook to break the back of exponentially-rising prices – even at the cost of a deep recession.
The second oil shock triggered a capital spending boom in energy-related sectors, which appeared in aggregate economic figures as the beginning of a recovery. However, Volcker’s muscular monetary policies soon threw the economy back onto a recessionary path.
In the 6 months between January and July 1980, the U.S. GDP declined 2.2%. But, after the energy-related growth bump in the 16 months between January 1981 and November 1982, the GDP lost another 2.7%. At the time, it appeared to me as one long recession, during which interest rates reached historic highs, and the stock market’s P/E ratio again touched its historical, single-digit low of late 1974.
My memory of the 1980-1982 decline is one of an excruciating wait that felt like an elongated U-shaped bottom if one when values were steadily appearing at unhoped-for prices. In the midst of the decline, I sent a letter to our clients entitled: “Happiness is a dull portfolio” – a statement that was vindicated a year later, after the recovery got underway.
1987: A One-Day Bear Market, No Recession but Eventually Everything Suffered
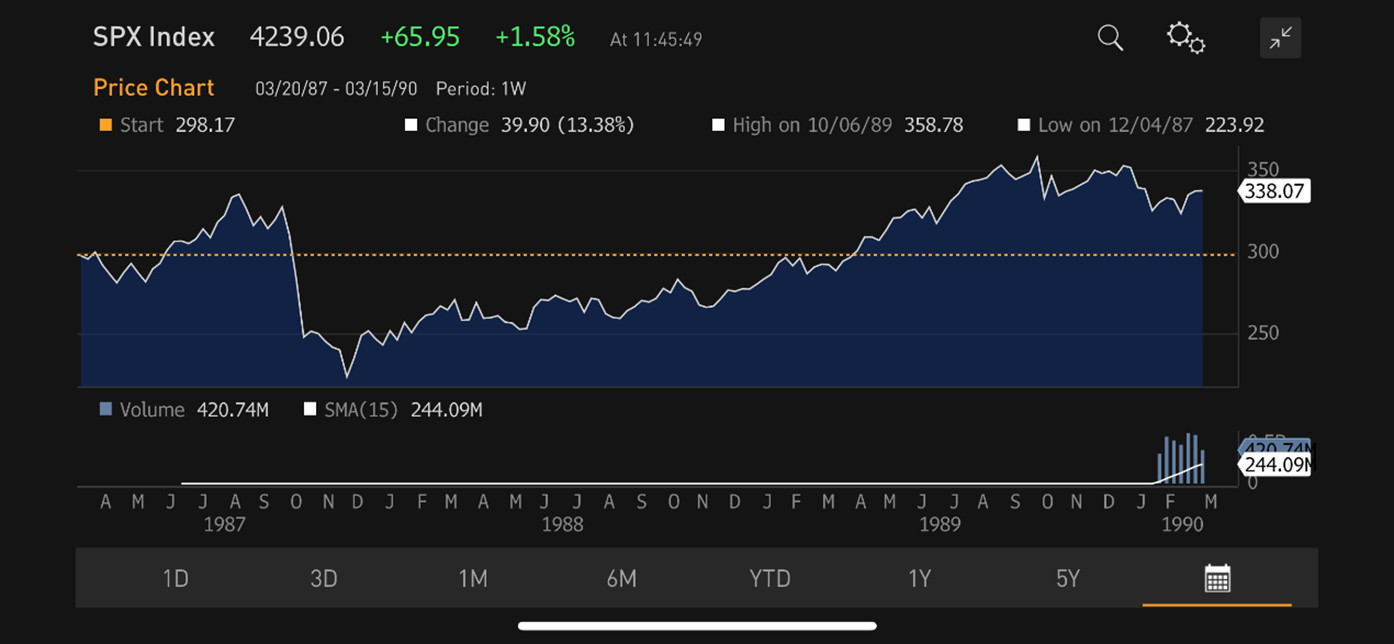
Source: Bloomberg.
Throughout the early months of 1987, the economy gave signs of weakening while stock market valuations became increasingly stretched. I had just launched the Tocqueville fund and was very reluctant to invest the inflow of cash, instead of maintaining significant reserves. After a few months, some shareholders, many of whom I knew personally, began to complain that they were not participating in the ebullient stock market. I finally gave up and invested a significant portion of the liquid reserves.
Then, on what has come to be known as Black Monday (October 19, 1987), the Dow Jones Industrials Average of the stock market lost almost 23% in hours! Nassim Taleb, author of the well-known book The Black Swan (Random House, 2007) had not yet written: “It is far easier to figure out if something is fragile than to predict the occurrence of an event that may harm it.” So most investors were taken by surprise. The wave of selling was such that the “tape” was hours late, and actual stock prices would not be known for many hours, sometimes days. Once final prices were printed, however, it looked like the Fund’s portfolio had held up quite well, and I thought we were geniuses. But with further reflection, another explanation became clear:
When investors must sell in a panic (whether for psychological reasons or because of margin calls if they bought on credit), they sell what they can offload most easily. That usually means the more liquid shares of the larger companies.
Our Fund had been mostly invested in shares of smaller or medium-sized companies, which were below the radars of those panicked investors. As a result, these shares survived the first selling wave quite well. In the following weeks, however, this segment of the market played catch up (or down, rather), and by the end of the year, our Fund had declined almost as much as the stocks making up the index. The market did not recoup its 1987 loss until mid-1989.
2000-2001: The Dot.Comedy
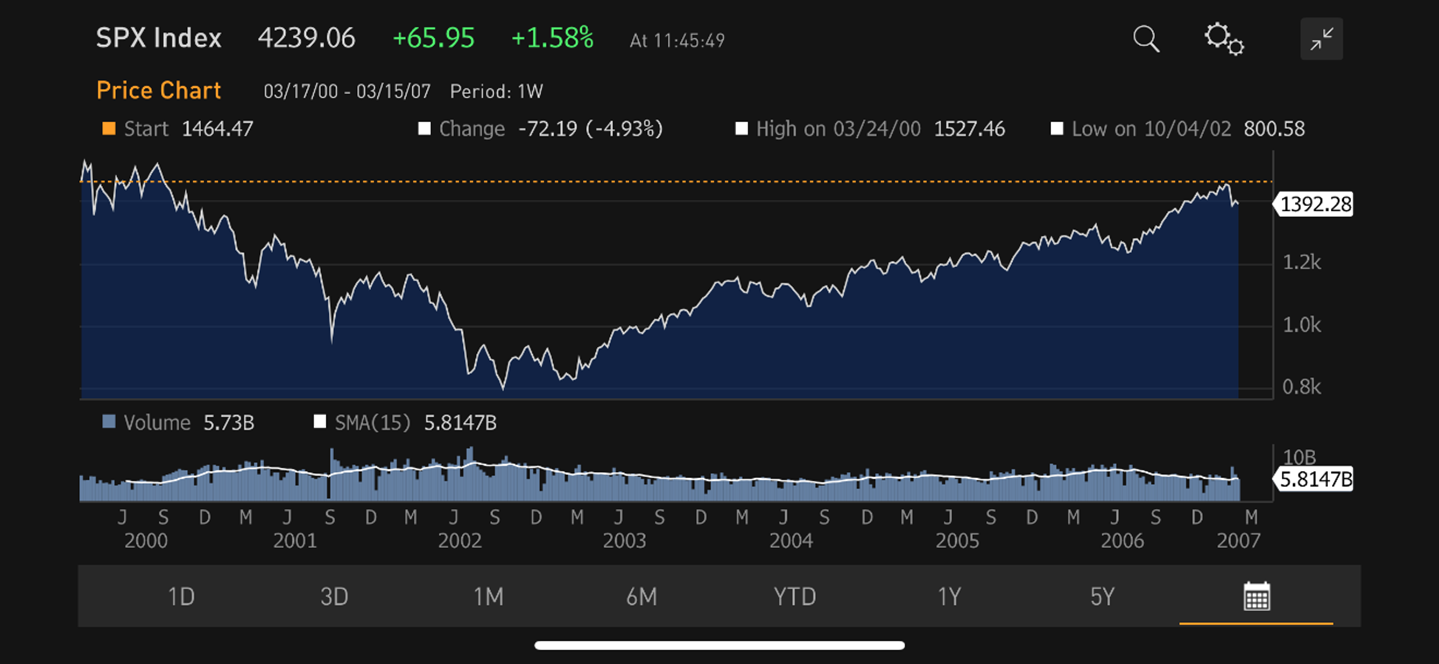
Source: Bloomberg.
The 1990s were a period of intense speculation in the segments of the market linked more or less closely with the nascent Internet. By the end of the decade, companies with a .com suffix, real or implied, with or without earnings, were selling at valuations never before imagined.
We found it be fairly easy to escape the carnage that ensued: the likes of AOL and shares of other companies promising to change the world through the Internet eventually collapsed. Like the Nifty Fifty in the 1970s, they did not reclaim their 2000 highs until several (7, in this case) years later – for those that survived. But, if you resisted the clamor of clients wanting to “participate” and avoided these fanciful investments, your portfolios performed fairly satisfactorily through the entire cycle.
2007-2009: Generalized Junkyard
The advent of what became known as The Great Recession vindicated Hyman Minsky’s hypothesis that “stability breeds instability,” usually through increasing risk acceptance, financial leverage, and speculation.
In the years leading to 2007, real estate speculation had reached new highs, with banks and other financial intermediaries entering into “sub-prime” financing. Some of the less ethical even encouraged mortgage borrowers to lie about their financial condition. By 2008, the speculative bubble and associated Ponzi-like schemes collapsed, causing major bankruptcies and necessitating the bailout of some major financial institutions.
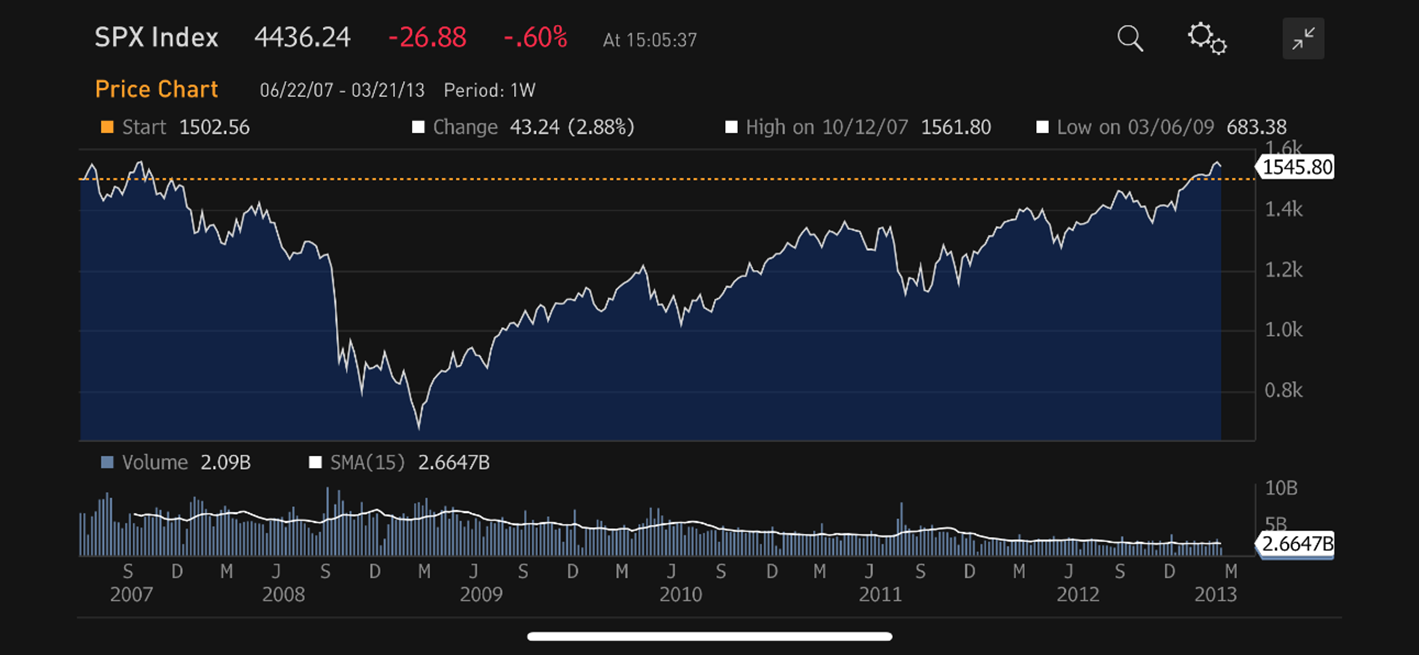
Source: Bloomberg.
There had been some scary financial accidents before (for instance, Long -Term Capital Management’s collapse in the late 1990s). However, in my memory, this was the first time that a financial crisis prompted an economic recession that engulfed every sector of the market and the economy into its downward spiral. It may well be the prototype for future crises and recessions.
After recovering to its 2007 high in 6 years, the stock market responded well to monetary and budgetary stimulus in the following decade, up to the early 2020s. But the economic recovery was uneven and hesitant, both domestically and globally.
Geopolitics and De-Globalization
Just as the global economy was beginning to recover from various COVID waves, Russia invaded Ukraine, further aggravating supply chain problems and threatening both an acceleration of inflation and, more recently, a serious economic slowdown.
In the last few decades, financial crises and resulting economic recessions have tended to originate at the periphery of the larger economies. This phenomenon began with the Asian crisis of 1997, which started with the relatively unobserved Thai currency, the bhat.
The globalization trend that has characterized the widespread post-WWII boom has benefitted the world economy by spreading growth to previously under-developed economies and lowering costs (through imports or offshoring) for developed economies. However, in the wake of the Russian invasion of Ukraine and the hardening of U.S. relations with China, it seems probable that this trend will reverse to one degree or another. Most countries will attempt to become more self-sufficient as regards important resources or strategic products. This scenario implies slower growth of the global economy.
Another scenario that concerns me involves the continued strength of the U.S. dollar coupled with a return of U.S. interest rates to more “normal” (higher) levels. On the surface, such a combination may seem counterintuitive. Raising rates to combat an economy’s inflationary tendencies should eventually slow down that economy and raise the specter of recession, which normally should weaken the country’s currency.
However, we live in a complex and paradoxical environment. Financial and currency markets have been unusually volatile, and the U.S. dollar has behaved as a haven currency, continuously edging up in value as many other currencies have tended to weaken. If this trend persists despite an opposite prognosticator consensus, we may temporarily experience a combination of higher rates and a strong dollar. Many developing countries and other stressed foreign borrowers have borrowed in U.S. dollars at floating interest rates. They would then face the double whammy of higher currency and interest repayments.
As I mentioned earlier, financial crises in recent years have tended to originate at the periphery of major economies, where transparency is elusive, the role of the U.S. Federal Reserve more diluted, and the size of consequences is often difficult to anticipate. It seems like a good time to prepare for the unexpected and look for signs of stress in the less-monitored areas of the globe.
François Sicart – 4/4/2022
Disclosure:
The information provided in this article represents the opinions of Sicart Associates, LLC (“Sicart”) and is expressed as of the date hereof and is subject to change. Sicart assumes no obligation to update or otherwise revise our opinions or this article. The observations and views expressed herein may be changed by Sicart at any time without notice.
This article is not intended to be a client‐specific suitability analysis or recommendation, an offer to participate in any investment, or a recommendation to buy, hold or sell securities. Do not use this report as the sole basis for investment decisions. Do not select an asset class or investment product based on performance alone. Consider all relevant information, including your existing portfolio, investment objectives, risk tolerance, liquidity needs and investment time horizon. This report is for general informational purposes only and is not intended to predict or guarantee the future performance of any individual security, market sector or the markets generally.