Beyond The Headlines
Where is the Bottom?

We’ve had days and weeks recently when stock prices only pointed downwards. The major US indices fell some 20%-33% from their highs recorded late last year. It’s no surprise that we are all wondering where the bottom could be. Let’s see what we can find out.
When I hear about market indices and averages, I think of a lake I grew up visiting as a kid with my cousins. Our grandpa would warn us at times. He’d say that one can drown even in a lake only inches deep on average. He said so because that particular lake had seemingly never-ending vast ankle-deep shallows, but then there was an old river valley in the middle. It had steep walls and dropped to 20 feet or more. As kids, we were curious and found the edge of it many times. The water there was cold, and you could feel the current that could take you out to the middle of the lake like a feather.
On average, it might have been a shallow lake, but it was not the complete picture. The same the markets might go up or down at times, but it hardly ever is all we should know.
The indices can comprise anything from 30 to thousands of stocks. They are constructed in various ways, and their composition is subject to change. They are manmade, not god-given. Their daily price and movement may give some idea of the market’s general direction, but it’s an imperfect picture.
As you remember, we don’t manage our portfolios to any particular index. We prefer to hold 30-60 well-selected companies, each with its own specific story. They are not immune to market gyrations, but given that they tend to have strong balance sheets and sustainable earnings power, they usually march to their own beat. They might fall behind when the broad market rises quickly, but they may hold their ground better when the market drops. They are slow and steady rather than fast and furious.
The fast and furious stocks drove the markets higher in 2020-2021. Many had little profit to show for. Their valuations expanded, and their stock prices reached what we thought were eye-popping levels. They seemed to promise growth beyond anyone’s imagination. These are tales we heard before, and we had our suspicions that eventually, the reversal to the mean will bring them back in line and closer to reality – Has that happened already?
The Profitless Tech UBS stock basket dropped from 100 to 60 in March 2020; then it rose to 220 by early 2021; it hovered at 200 through most of 2021, only to take a nosedive back to 60 most recently, a 72% drop. It looks like a big air bubble that inflated and burst right after, only to be back to square one.
UBS Profitless Tech
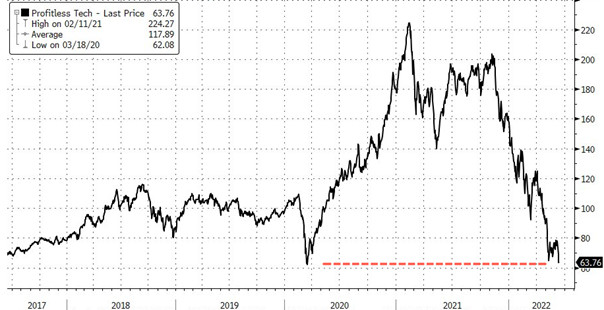
Source: UBS Profitless Tech
Another way to look at the fast and furious stocks of the last two years would be the valuation. The chart below shows a group of internet stocks that enjoyed what we thought was an incredible boost. The market was willing to pay 2x-4x as much for each dollar of their earnings as in previous years (see chart below). It felt to us like a paradigm shift. Somehow any previous models and assumptions seemed to not apply anymore, and those stocks deserved a much higher valuation. That bubble burst as well.
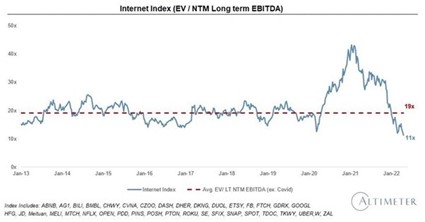
Source: Altimeter.
Is all the air out? In some pockets of the market, maybe, but then looking at other hyped-up “assets” of the last two years, we might think there is more air to let out.
Out of curiosity, we looked at the total value of cryptocurrencies. These new assets with no profits, no revenue, and not much to show for other than a digital record also enjoyed a heyday. The tracked value of all cryptocurrencies touched $3 trillion last year. That’s a ten-fold increase from the levels recorded in the prior years. $2 trillion of that value vanished already, with little under one trillion remaining. Some reversed their stance and argued that now cryptocurrencies are worth zero, if they are right, then that bubble hasn’t burst completely yet.
We often say that what we don’t own matters as much as what we do own, especially in a bear market. We had no interest in cryptocurrencies and no interest in profitless technology companies either. We still don’t.
Where is the bottom? If the biggest critics of cryptocurrencies are right and they are indeed worthless assets, the bottom is a trillion dollars away; they are 2/3 of the way there. For profitless tech and internet stocks, we reached a bottom that those stocks reached before both in prices and valuations (see earlier charts). Is it THE bottom? We are yet to see.
There might be more air left in various market segments; there might be more market volatility all around as businesses, consumers and governments learn to operate with higher inflation, rising interest rates, and economic slowdown or a recession.
As much as tech stocks led this market correction, there are big swaths of the market that held up just fine. A good proxy for them could be a high dividend yield index or ETF (exchange trade fund) that track quality businesses with dividend income. Those stocks have been rangebound and seemingly barely moved since May 2021. Looking at their YTD performance, they are still down, but only some 9%, which is much less than any previously hot flying stocks.
High Dividend Yielding Stocks
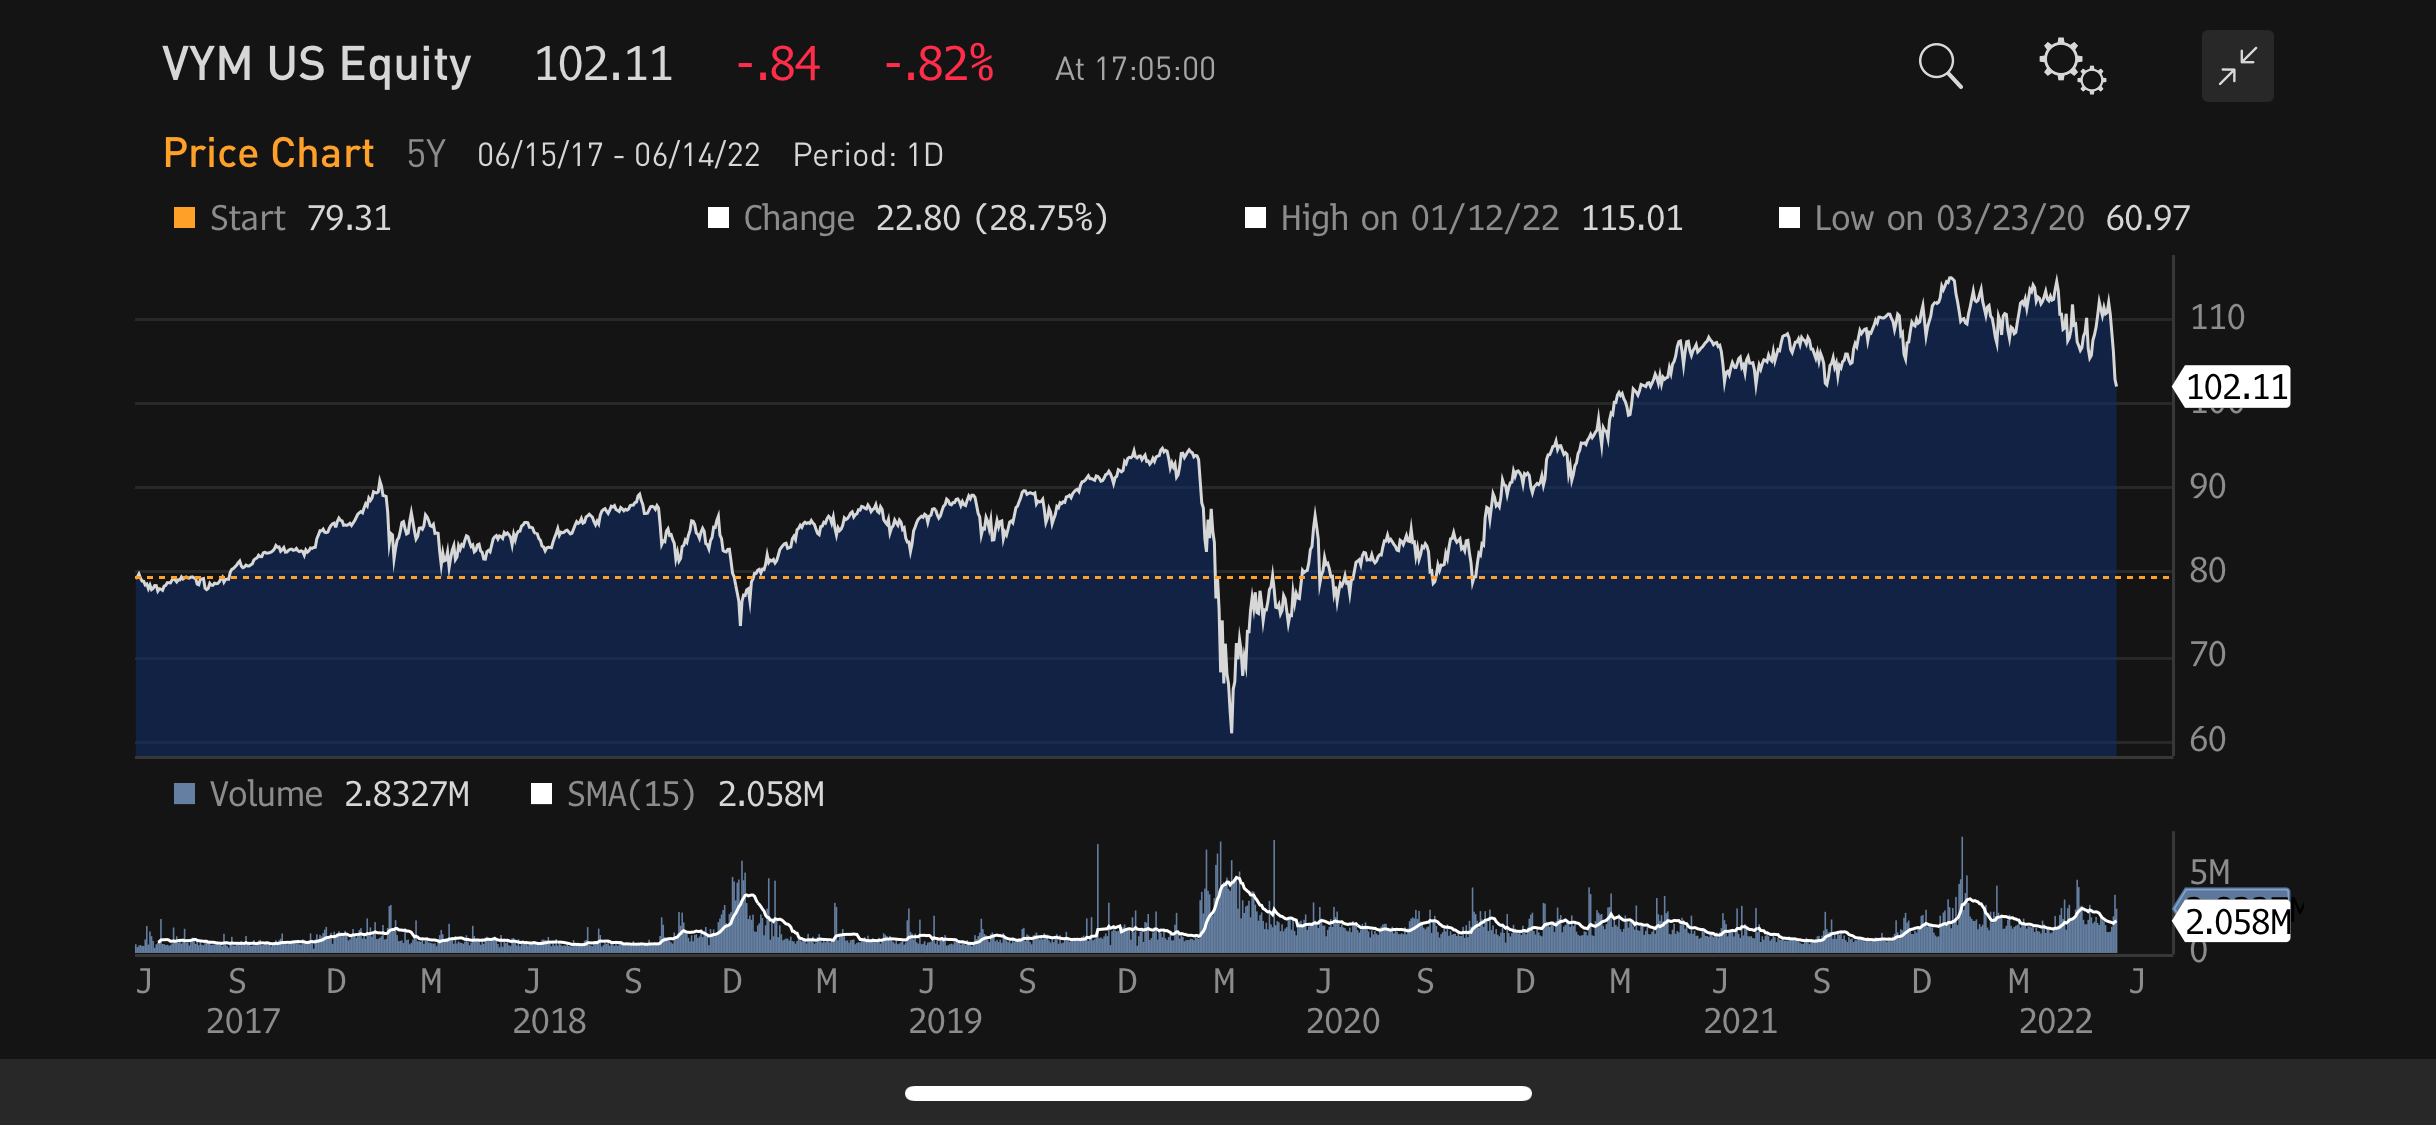
Source: Bloomberg, Vanguard High Dividend Yield / FTSE High Dividend Yield.
We look for clues in the earnings release, not daily price actions. We worry less about earnings beats or misses in a particular quarter. We are more focused on long-term sustainable growth and profits.
We never knew where the bottom of the lake was as kids, we might not know exactly where the bottom of the market is today, but we are very encouraged to see renewed skepticism among investors. We think it’s a healthy break from last year’s euphoria and sell-offs create buying opportunities for patient and disciplined investors. As we wait and search for the bottom, we expect to find plenty of new holdings among stocks that are being thrown out like the proverbial baby with the bathwater. They could make a very respectable contribution to our portfolios’ performance in the next few years. We proceed slowly and gradually, though, as always.
Happy Investing!
Bogumil Baranowski
Published: 6/15/2022
Disclosure:
The information provided in this article represents the opinions of Sicart Associates, LLC (“Sicart”) and is expressed as of the date hereof and is subject to change. Sicart assumes no obligation to update or otherwise revise our opinions or this article. The observations and views expressed herein may be changed by Sicart at any time without notice.
This article is not intended to be a client‐specific suitability analysis or recommendation, an offer to participate in any investment, or a recommendation to buy, hold or sell securities. Do not use this report as the sole basis for investment decisions. Do not select an asset class or investment product based on performance alone. Consider all relevant information, including your existing portfolio, investment objectives, risk tolerance, liquidity needs and investment time horizon. This report is for general informational purposes only and is not intended to predict or guarantee the future performance of any individual security, market sector or the markets generally.
UBS Profitless Tech basket tracks the performance of emerging high-growth tech and tech-enabled companies which have yet to complete a full year with positive earnings. The basket has been optimized for liquidity with initial weights capped at 4%. Created on May 18, 2020 – rebalanced and reconstituted annually.
Vanguard High Dividend Yield ETF tracks the FTSE High Dividend Yield Index. The index selects high-dividend-paying US companies, excluding REITS, and weights them by market cap.