February 2017 Monthly Letter

Highlights: Higher highs, earnings season, Fed rates unchanged, car loan record delinquencies, political commentary

 Portfolio-specific commentary (12/31/2016-2/22/2017) Year-To-Date

Healthcare (biotech) and selected technology

 Improved sentiment helped our biotech holdings YTD, and our higher-than–the-S&P-500 exposure made a meaningful difference in our performance. We have a long-term view on the sector, and remain optimistic about its prospects, especially for selected holdings with the most attractive positioning.

Some of our technology holdings benefited from an upbeat earnings season (Mobileye), and M&A activity (Ultratech).

On the other hand, we saw weakness in our energy sector, where we have higher-than-the-S&P 500 exposure. We feel comfortable with our picks in the sector, and look forward to their satisfactory performance in the long run.

 Big-picture commentary

 Higher highs for the stock markets

After experiencing an especially nervous market not long ago, when stocks would quickly sell off on any bit of negative news, we are now witnessing what some call the “Teflon market.” Despite all the noise coming from Washington investors remain very optimistic, pouring money into the market and counting on economic growth. Both the Dow Industrial Average and the S&P 500 are up 5-6% YTD (2/23/2017), and recently hit all-time highs. UK, France, Germany, Japan, Brazil are climbing to new highs as well.

Earnings season – encouraging growth, but peak valuations

 With almost all earnings reports for the 4th quarter behind us, we can tell that this will be the first time in 2 years that we have seen two consecutive quarters of earnings growth for the S&P 500. Estimated 12-month forward earnings per share for the index have reached a new high ($133.50 Source: Factset), but the 12-month forward P/E also reached a peak level that we haven’t seen since 2004 (17.6x).

Two thirds of companies beat earnings expectations – with technology and health care leading the pack — while telecom services and utilities had the most disappointing results. Eight sectors reported y/y EPS growth including utilities, real estate and financials, while 3 sectors reported y/y declines with telecom services being the weakest.

 Fed leaves rates unchanged

In February, the Federal Reserve kept the rates unchanged. Remember that in December, we saw a 25-basis point hike, which was only the second increase in more than 10 years. It sets a new trend that shouldn’t be a surprise, but many may have long forgotten the world of normal rates, so it may prove to be a rude awakening for some.

We welcome further rate increases, and the end of easy money policies. We trust it will lead to a long-awaited reset in asset prices, return expectations, and debt levels across consumers, businesses, and governments.

We also believe rates increases may be a bigger determinant of the markets’ direction than new tax and trade policies, or a wave of deregulation. Any further rate increase from such low levels implies a very high percent increase in the cost of debt for all participants. It’s hard to imagine it won’t affect their behavior, and prompt an adjustment in levels of borrowing and spending.

 Car loan record delinquencies

 We like to call out, now and then, an intriguing new market dynamic that deserves more attention. Quartz recently published an interesting article on auto loans – “American car buyers are borrowing like never before—and missing plenty of payments, too” (February 21, 2017). Here are some highlights.

Last year, Americans bought more new cars than ever before. Is that meaningful? Car sales represent a fifth of all retail spending. US outstanding auto loan debt reached a new high, $1.2 trillion, 9% up y/y, and 13% higher than the last peak in 2005 (inflation-adjusted). Wages haven’t gone up much since the Great Recession. Lending has been the main growth driver. Interestingly enough, nearly a quarter of auto loans are subprime loans which carry an average 10% annual interest rate. This may look compelling to investors seeking yield, but around half of auto loan asset-backed securities (ABS) feature subprime collateral. Auto loans are a tiny phenomenon versus mortgages. In 2007, Americans had $10 trillion in mortgages with $7 trillion securitized, compared to $1.2 trillion in auto loans, with under $100 billion securitized.

Forbes (February 17, 2017) recently reported that newly delinquent car loans reached an 8-year peak. This doesn’t go unnoticed. Car makers have been hinting at sales pressures, poor appetite for cars, dwindling demand, seeing sales go from “record to rocky.”

 With rates heading up, and other metrics at peak level (total loans outstanding, percentage of cars bought with financing, average loan amount, average selling price) it’s not hard to envision a turn in that trend.

Will it be contained to only one sector, will it spill over, is it a good indicator of the overstretched consumer? The jury is still out on the subject, but we have an inkling that we might know the answer. Surprisingly enough, the biggest US car maker is trading at a multi-year high.

There is a disconnect there somewhere…

Political commentary

 It’s hard to escape the daily deluge of political headlines. In earlier letters, we listed some of the potential policies that may affect the consumer, the labor market, and businesses. We don’t share the market’s enthusiasm. We are patiently waiting for specifics, and we remain cautious in terms of our expectations. We believe that if some of the earlier-hinted measures do materialize, the beneficial impact, if any, will take time to become more visible.

Lastly, with the US stock market up over 10%% (on top of previous highs) since the presidential election, a lot of that theoretical future growth in profits appears to be more than priced in.

 Looking for opportunities

During periods of new market highs, we may not be big buyers of new positions, and we may not be adding aggressively to existing holdings. We spend this peculiar time reviewing our investments, while carefully and deliberately examining potential future acquisitions.

The process remains especially difficult given that we don’t know where the potential market weakness will come from, or where it will hit the hardest,– thus creating the best buying opportunities. Holding higher-than-usual cash levels keeps us to some extent immune to a market sell-off, and better positioned to act when the prices of securities become more compelling.

We have been generously compensated by the market for our patience before, and we believe this time will be no different.


Yours truly,

François Sicart, Allen Huang & Bogumil Baranowski


Disclosure


This report is not intended to be a client‐specific suitability analysis or recommendation, an offer to participate in any investment, or a recommendation to buy, hold or sell securities. Do not use this report as the sole basis for investment decisions. Do not select an asset class or investment product based on performance alone. Consider all relevant information, including your existing portfolio, investment objectives, risk tolerance, liquidity needs and investment time horizon. This report is for general informational purposes only and is not intended to predict or guarantee the future performance of any individual security, market sector or the markets generally.


OBSOLETE ECONOMIC STATISTICS, CONFUSED POLICY MAKERS: HOW SHOULD INVESTORS NAVIGATE THE MINEFIELD?

In a previous paper (http://sicartassociates.com/would-the-real-economy-please-stand-up/), I argued that policy makers are being increasingly misled by statistics that were created to measure the 20th-century industrial economy. Our more virtual, 21st-century economy is hard to capture with such obsolete methods.  I concluded with a question, which I promised to answer in a forthcoming paper:

“Faced with contradictory indicators that seem to be confusing policy makers, what should investors do?”

My intuitive answer to such a question would be: “Nothing special.” Many observers, ourselves included, believe that there is little usable correlation between the growth of economies and their stock markets’ performances.

Economy and Stock Market: A Very Independent Relationship

Renowned economist and 1970 Nobel Prize winner Paul Samuelson famously quipped that: “The stock market has called nine of the past five recessions.”

Indeed, the correspondence between the strength of a stock market and the health of its economy is not what the public generally assumes. One of the best-known studies on the subject was done by Elroy Dimson, Paul Marsh and Mike Staunton at the London Business School in 2005. They examined 17 countries over more than 100 years and actually found a negative correlation between investment returns and growth in GDP (Gross Domestic Product) per capita:

“Historically, buying into equity markets with a high GDP growth rate has given a return that is below the return of markets with a low GDP growth rate. There is no apparent relationship between equity returns and GDP growth.” (Global Investment Returns Yearbook, 2005)

More recently, according to the New York Times (“The Economy and Stocks: A Big Disconnect” 12/16/12), the Vanguard Group looked at equities’ returns going back to 1926. They examined the predictive power of important variables such as price-to-earnings (P/E) ratios, growth in GDP and corporate profits, past stock market returns, dividend yields, interest rates on 10-year Treasury securities, and government debt as a percentage of GDP. Their conclusion was that “none of these factors come remotely close to forecasting accurately how stocks will perform in the coming year”.

“Even over a 10-year time horizon, considered by many investors to be long term, only P/E ratios had a meaningful predictive quality.”

With a narrower focus on just the US market, Crestmont Research compared GDP growth and the change in the Dow Jones Industrial Average (without dividends) decade by decade and also for selected secular bull and bear cycles through 2015.

The disconnect between economic growth and stock market performance is inescapable.

1

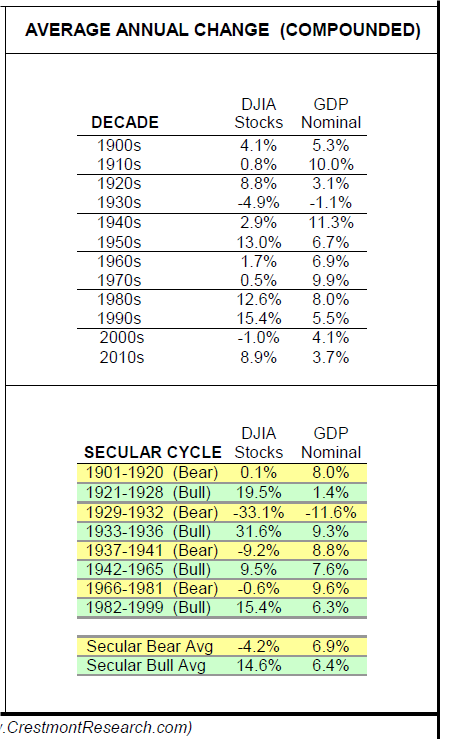
Source: Crestmont Research

Looking for Wisdom Outside of Economics

Early in my career, an economist at the US Federal Reserve consulted me about opening an account with my firm, Tucker Anthony, because she realized that “economists usually do a poor job of managing their own investment accounts.” The same realization may explain why the 2002 Nobel Memorial Prize in Economic Sciences was awarded to Daniel Kahneman — a psychologist!

I have long been fascinated by the relatively new discipline of behavioral finance, also popularized by researchers such as Richard H. Thaler (Misbehaving: The Making of Behavioral Economics, 2015) and Robert J. Shiller, another Nobel laureate (Irrational Exuberance, 2000). Kahneman’s book (Thinking Fast and Slow, 2011) on the psychology of judgment and decision-making is full of profound and entertaining insights, including many about investing. For instance:

Hindsight, the ability to explain the past, gives us the illusion that the world is understandable… We should accept the world is incomprehensible much of the time… You can protect against certain scenarios better than you can predict them.

Many individual investors lose consistently by trading — an achievement that a  dart-throwing chimp could not match…

Unfortunately, Prof. Kahneman is not impressed by the competence of investment managers either:

For a large majority of fund managers, the selection of stocks is more like rolling dice than like playing poker.

There are domains in which expertise is not possible. Stock picking is a good example. (Time Magazine – 11/28/11).

It is wrong to blame anyone for failing to forecast accurately in an unpredictable world. However, it seems fair to blame professionals for believing they can succeed in an impossible task.

Some Investors, Including Professionals, Consistently Fail to Perform

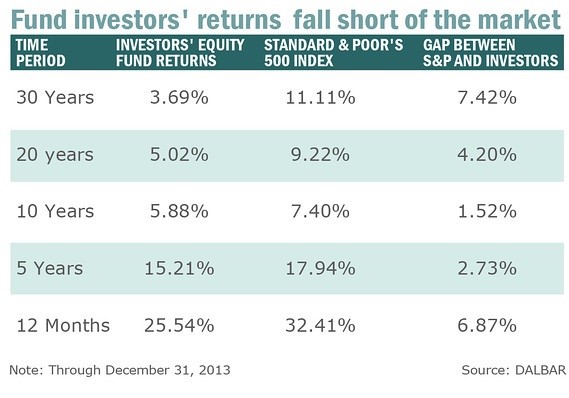
It is no secret that most professional investment managers fail to equal the performance of their benchmark indices and that many individual investors actually lose money over long periods. Performance-measurement firm DALBAR tracks mutual fund purchases and redemptions by investors to calculate the actual returns earned by these investors, with the following results:

3

The following press extracts also confirm that most investors underperform the main stock market indices over time:

In Europe, 86 per cent of active equity funds failed to beat their benchmarks over the past decade, according to S&P’s analysis of the performance after fees of 25,000 active funds. (Financial Times – 3/20/16)

According to S&P Dow Jones Indices, 82% of large-cap funds generated lower returns than the S&P 500 in the latest 10 years.  (USA TODAY– 3/14/16)

Despite this evidence, I respectfully disagree with Prof. Kahneman. If a majority of investment managers fails to equal or beat their benchmarks over relevant periods of time, it must mean that a minority does achieve that goal.

Of those, no doubt a few possess exceptional skills that common mortals do not. Their results would be hard to replicate. But I usually try to follow the advice of Warren Buffet and Charlie Munger, which they learned from nineteenth-century mathematician Carl Gustav Jacob Jacobi’s advice for solving problems: “Invert, always invert.”

In our case, that inversion means not seeking out popular stocks for their potentially big returns. Instead, we should concentrate on avoiding the mistakes that cause the majority of stock market losses.

What are (some of) those mistakes?

The Mythology of Investment Success Can Be Dangerous to Your Wealth

One common error is viewing the stock market as some magical box that can be unlocked by discovering a secret formula. Another is the belief that the stock market is constantly being manipulated by obscure forces beyond the common man’s control. More routinely, some clients expect their investment advisers to be omniscient, with a special gift for predicting the future.

These attitudes derive from what an early mentor of mine called “the quest for certainty in an uncertain world” – by definition a hopeless endeavor. In fact, one of the first precepts of investing is (or should be) that there is no certainty in investment. This is why we diversify our holdings.

The title of a 2014 book by strategist Ned Davis asks what should count most for investors: Being Right or Making Money?

If the main goal of diversification is to avoid being hurt by rare but unavoidable mistakes, then a useful investment goal would be a good “batting average” rather than a few “home runs.” The batting-average approach seems particularly appropriate to me, because it calls for common-sense discipline and avoids the dangerous tendency to be lured by narrative. One can lose a lot of money on “good companies” or “good stories” if stocks are not bought at the right price. But how to determine the right price?

Dollar Quotes Are Not an Accurate Measure of a Stock’s Popularity

 The stock market is an auction process, i.e. the price of a stock is determined by the bidding tussle between buyers and sellers. In the very long term, it can be argued that stock prices will grow with corporate profits. But over shorter periods of several years, the stock market is volatile and functions, frankly, more like a popularity contest.

To understand this, it is important to realize that the quoted price of company’s stock is meaningless in itself: it only has significance when compared to some fundamental value of the underlying company. For instance, the price/earnings ratio enumerates how much investors are willing to pay for the portion of that company’s earnings accruing to one share of stock. Note that price/earnings ratios give no precise signal to buy or sell a stock. But numerous studies have demonstrated that fluctuations in stock prices are caused more by changes in price/earnings ratios than by changes in earnings alone.

Furthermore, buying stocks at low price/earnings ratios results in better investment gains in the ensuing 10 years or more than buying at higher price/earnings ratios.

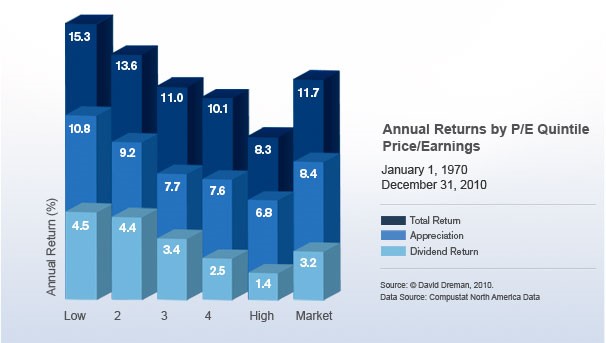
For example, Dreman Value Management measured the performance of the 500 largest US companies between 1970 and 2010. Here is what they found:

Including dividends, stocks with the lowest 20% of P/E multiples increased 15.3% annually, while stocks with the highest 20% of P/E multiples increased 8.3% annually, on average. The sample average, which closely tracks the S&P 500 Index, returned 11.7% annually during the same period.

4

When one looks at the compounded returns, the difference is staggering. An investment of $1,000,000 in the lowest P/E group in 1970 and switched annually would have ended up at $327 million at the end of 2010, compared to $26 million for the highest P/E group.

This corroborates our earlier comment: the batting average of investing in stocks with low price/earnings ratios should be better than the batting average of investing in stocks with high price/earnings ratios. And overall, investing in stocks with high price/earnings ratios tends to lower our odds of achieving excellent returns.

Putting Some Horse Sense in Investing

We cannot forget that fluctuations in price/earnings ratios are dictated principally by emotional and psychological factors. This is why, without assimilating it to gambling, stock market investing can in many ways be compared to betting on horse races. Expectations clearly differ from fundamentals when betting on horse races; they also do in the stock market. Michael J. Mauboussin explains, in The Success Equation (2012):

The fundamentals are how fast a horse is likely to run. A handicapper might estimate that based on factors that include the horse’s past finishes, the track condition, the jockey, the distance, and the strength of the field.

The expectations are the odds on the tote board, which can be translated into a subjective probability of a horse’s likelihood of winning…

[But] making money through betting on horses is not at all about predicting which ones will win or lose. It’s about picking the ones with odds—or a price— that fail to reflect their prospects—or value. In other words, [those where] expectations are out of sync with fundamentals.

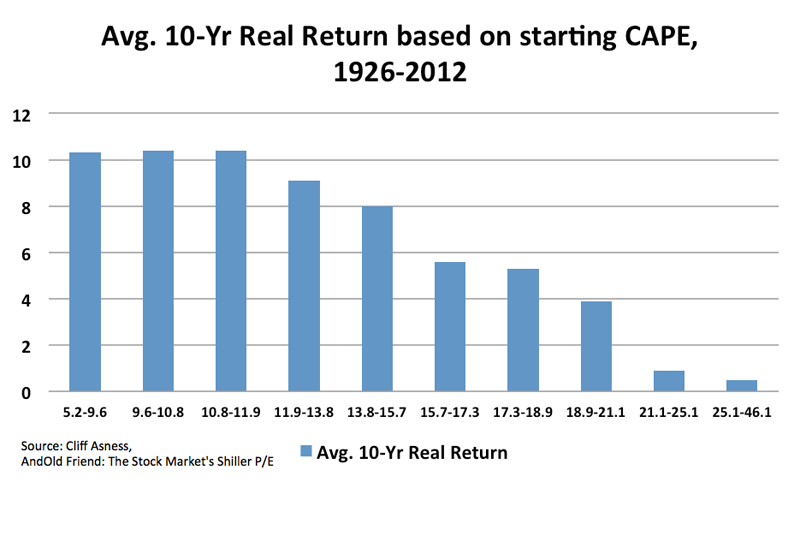
Being Guided by Price/Earnings Ratios Improves Our Potential Returns

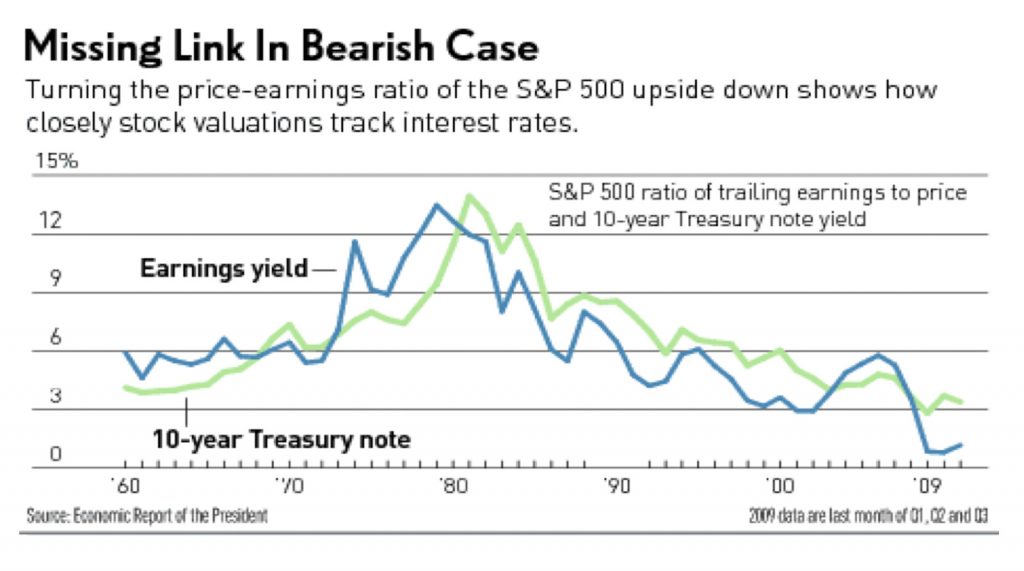
Valuation can help improve the timing of our exposure to the general market as well. In 1988 Harvard economist John Y. Campbell and Yale economist Robert Shiller developed a cyclically-adjusted price-to-earnings ratio (CAPE), which divides the current market price by the average inflation-adjusted profits of the previous 10 years (to attenuate the impact on earnings of the business cycle). Their work showed that for the general market, too, periods of high valuation tend to be followed by years with low returns and are better avoided, while periods of low p/e ratios are more propitious to investment, on a 10-year horizon:

5“It’s in The Price!”

The nature of an auction process is that the more broadly the object offered is desired, the higher its price goes. In the stock market, the better the fundamental story is, and the more widely it is known by the public, the higher the price/earnings ratio will be. This is why the odds of making money get worse as a stock rises: as old pros will warn you, by the time the story about a great company reaches you, it is likely that that story “is already in the stock’s price.”

In The Four Pillars of Investing (2002), William Bernstein reminds us that exciting investments are those that have attracted the most public attention and are thus “over-owned” In other words, their fame has attracted excess investment dollars. This drives up their price, thus lowering future returns:

… purchasing the past five or ten years’ best-performing investment invariably reflects the conventional wisdom, which is usually wrong.

… more times than not, the purchase of last decade’s worst-performing asset is a much better idea.

… In investing, the most exciting assets tend to have the lowest long-term returns, and the dullest ones tend to have the highest.

“Dare to be dull,” Bernstein advises… “A superior portfolio strategy should be intrinsically boring. If you want excitement, take up skydiving or Arctic exploration.”

Hubris, Naiveté and Marketing

In Thinking Fast and Slow, Daniel Kahneman explains why experts always seem so confident:

Experts who acknowledge the full extent of their ignorance may expect to be replaced by more confident competitors… An unbiased appreciation of uncertainty is a cornerstone of rationality—but it is not what people and organizations want. Extreme uncertainty is paralyzing under dangerous circumstances, and the admission that one is merely guessing is especially unacceptable when the stakes are high. Acting on pretended knowledge is often the preferred solution.

Investing under the illusion that certainty exists in our uncertain world is dangerous. In the current environment, uncertainty reigns. In a recent paper, I concluded:

No matter who won the elections, the task of the new President was bound to prove very challenging… The continued conflict between the forces of inflation and recession will likely intensify somewhat under a Trump presidency and we believe that keeping ample cash reserves remains the wise position for investors, especially at current valuation levels.

(http://sicartassociates.com/between-inflation-and-deflation/)

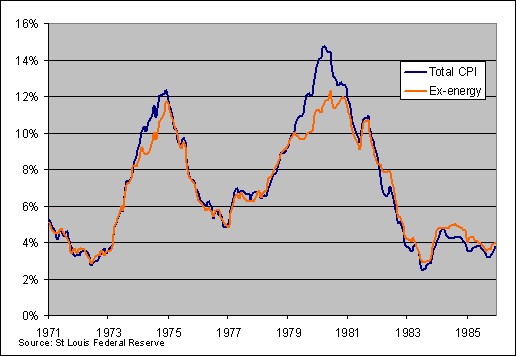
We now know that under Mr. Trump’s presidency, expansive fiscal programs run the risk of re-igniting inflationary pressures in an economy that, despite statistical confusion, is close to full employment. At the same time, promised mercantilist and protectionist policies are reminiscent of the deflationary ones that preceded and caused the global Great Depression, in the 1920s.

With today’s delicate balance between powerful forces of inflation and deflation, no one can credibly forecast the future. If the initial weeks of a Trump presidency have indicated anything, it is that erratic policy-making — in an environment where every decision has consequences to the second, third level and beyond — holds the promise of increased financial volatility.

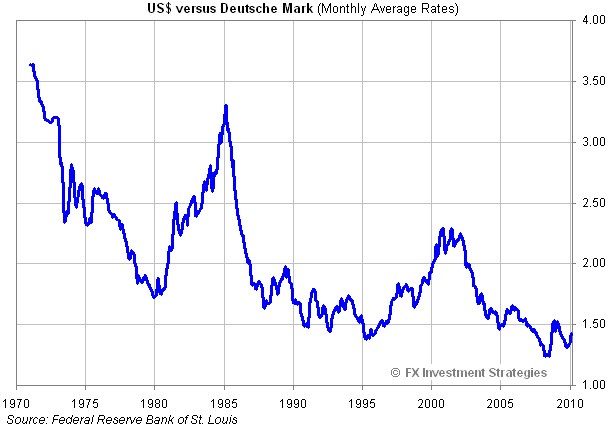
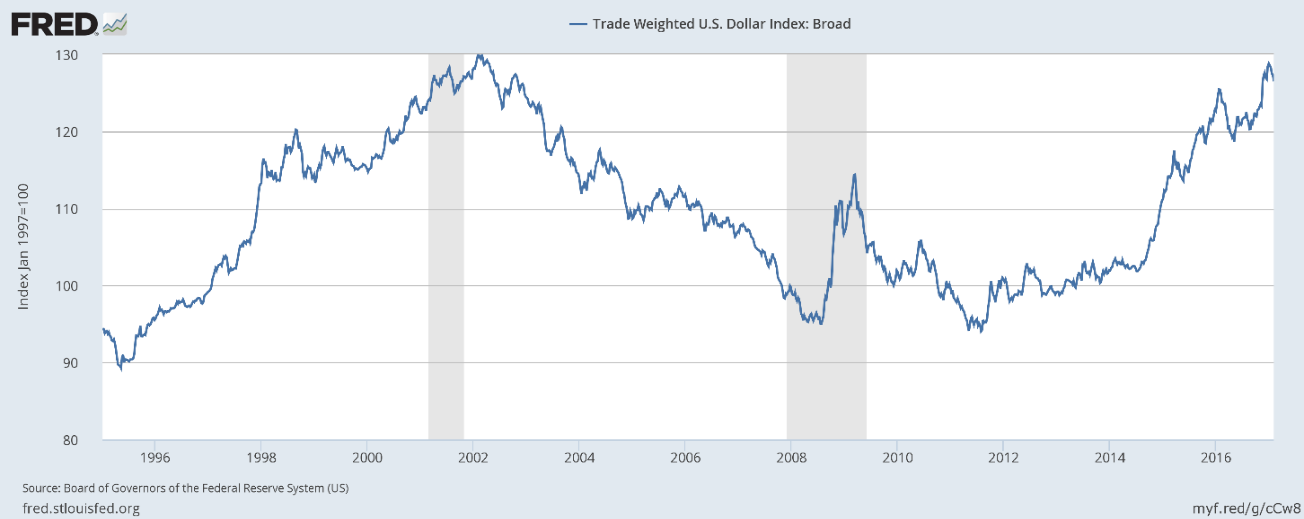
For example, since no one really knows which countries might get hurt by America’s protectionist tendencies, the dollar has risen strongly since 2015, to reflect its potential position as a refuge currency.

6

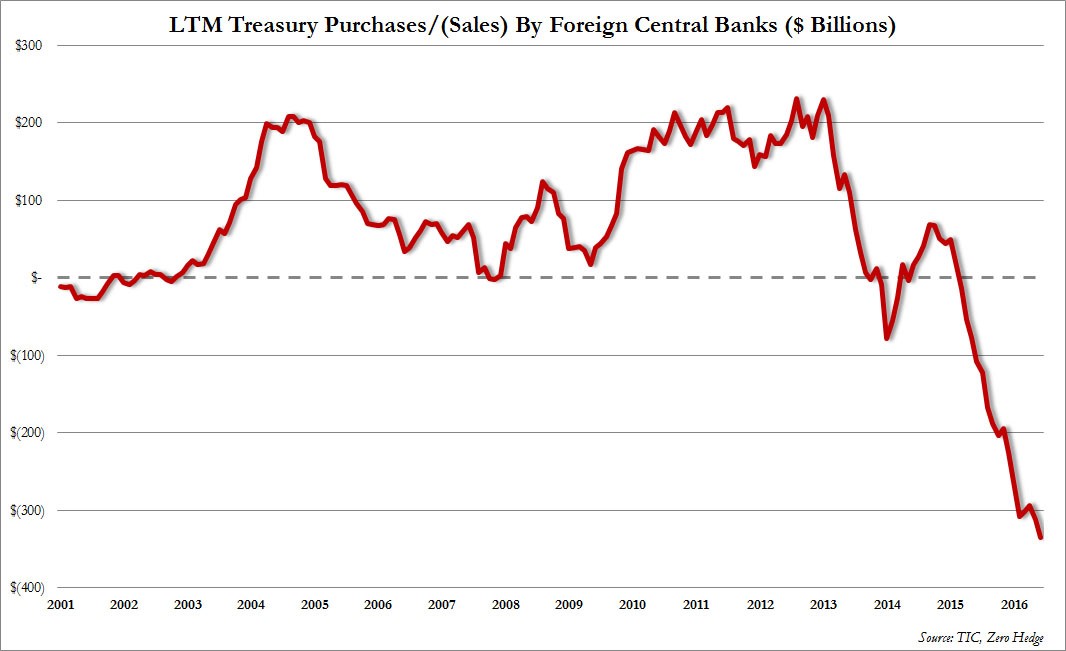
More recently, however, large foreign holders of US debt (Treasuries), including China, seem to have become aggressive sellers of dollars.

7

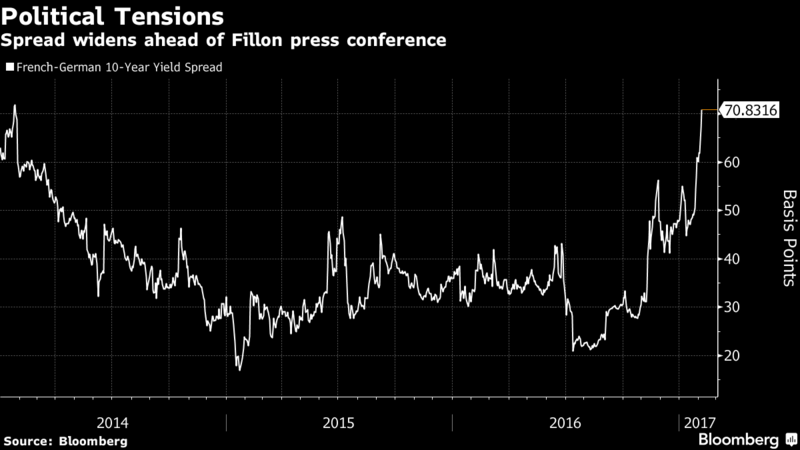
Uncertainties exist elsewhere as well. For example, reflecting election jitters and low (but not nonexistent) odds of a French exit from the Euro, spreads of French interest rates over those of other Euro debt have spiked to levels not seen in recent years.

8

Meanwhile, unstable foreign exchange and interest rate markets are potentially harmful to large banks, such as Deutsche Bank, which has encountered recurring problems. Recently, Deutsche Bank AG bought full-page ads in all major German newspapers to apologize for “serious errors” after misconduct costs helped tip the company into two years of losses.

Conclusion

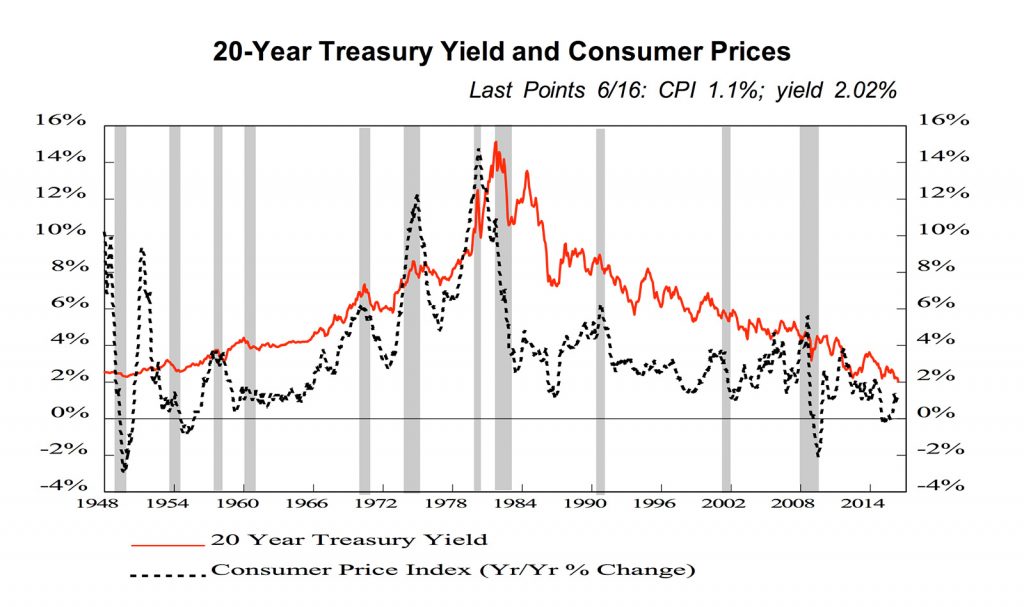
In our view, global stock markets currently offer few compelling values. Optimists argue that historically-high price/earnings ratios are justified by historically-low interest rates. But investors who do not enjoy dancing on top of volcanoes cannot ignore that record-low interest rates are usually followed by higher ones.

Erratic policies in the United States, and possibly in other countries facing changes in governments, are likely to trigger changes in expectations and thus increased volatility in price/earnings ratios. Yet experienced investors often view volatility as opportunity. If higher interest rates prompt lower price/earnings ratios, those of us who seek out value – and a few base hits to boost our batting average – may see new possibilities in the market.

One cannot forecast the future but ample cash reserves with, of course, minimal levels of financial leverage, remain the best way we can think of to be ready for it.

François Sicart

2/16/2017

Disclosure:

This report is not intended to be a client‐specific suitability analysis or recommendation, an offer to participate in any investment, or a recommendation to buy, hold or sell securities. Do not use this report as the sole basis for investment decisions. Do not select an asset class or investment product based on performance alone. Consider all relevant information, including your existing portfolio, investment objectives, risk tolerance, liquidity needs and investment time horizon. This report is for general informational purposes only and is not intended to predict or guarantee the future performance of any individual security, market sector or the markets generally.

January 2017 Monthly Letter

January, 24th, 2017

 Highlights: Trump’s policies, strong labor market, markets flat but still at record highs

 Portfolio-specific commentary (12/15/2016-1/15/2017)

Energy & Financials

 We saw a reversal of an earlier rally in both sectors, both the broad market and our holdings. Our smaller-than-S&P 500 exposure to financials left us on the sidelines of the recent declines. Our mix in the energy sector (different from the overall markets) turned out to be also helpful. We notice that sectors started to trade less uniformly than before, with some stocks falling behind, some climbing higher. This more varied price reaction may create opportunities.

Gold

Our gold exposure allowed us to capture a recovery in gold prices since December low, which we had seen after a sell-off from mid-year highs.

 Big-picture commentary

 Trump’s plans

We don’t know the specifics or the timing of various new policies, but given the likely direction  — less regulation, lower taxes, and possible foreign cash repatriation – those should help businesses reinvest, hire and grow. What may be seen as negative is the uncertain direction of the trade policy. With a more protectionist approach, we may see winners and losers among businesses, and potentially higher prices for end consumers.

Businesses won’t prosper if the consumer doesn’t do well. What we find encouraging is the tax reform, which could leave more cash in people’s pockets. The pro-employment narrative of the current administration may help further improve labor market conditions. Of concern is the potential impact of healthcare reform: its timing, execution, and cost to businesses and consumers.

Strong labor market and climbing wages

The end of 2016 marked a solid performance for the U.S. labor market, with paychecks growing at the fastest pace since 2009 and with job gains above 2 million for a sixth year (2.2 million in 2016 vs. 2.7 million in 2015). This amounts to 75 consecutive months of job growth, a modern-day record, with the number of employed people at all-time high. Wages went up 4.7% year over year in December and joblessness rated ticked up to 4.7%. In 2016, wages were up 2.9% versus a 2.3% decline in 2015, and 2.1% decline in 2014. The four-week average jobless claims dropped to the lowest since 1973.

Know-nothing market

 After a post-election rally, since mid-December the Dow Jones Industrial Average has traded in the tightest range in its 120-year history. The CBOE Volatility Index has been dropping since November, and reached 11.50, which brushes against its historically lowest levels.

Markets at their record levels

Major US indices — the Dow, S&P 500, and Nasdaq — are all at record highs. Looking around the world, in local currency, the UK market and German markets are also at or near all-time highs. Even the Mexican stock market has reached new highs. Japans is also close to its 18-year high. China still happens to be substantially below its 2015 peak.

Strength in the dollar makes the picture more interesting. In dollar terms, the markets with the biggest drops from a 52-week high are Turkey, Malaysia, and Mexico. The declines range from 20% to almost 30%, with Turkey falling the furthest.

 Dollar a little weaker

After a spike to the 15-year high in December versus EUR, 30-year high versus GBP, and 10-year high versus JPY, the dollar lost some of the gains in January. As we discussed last month, US interest rates are expected to continue rising after a December Fed rate hike and further planned increases this year. This upward trend, along with hopes for stronger growth may continue to support the dollar’s strength for a while.

Looking for opportunities

We’re clear about what kind of companies we look for and what kind of prices we would like to pay. However, with current high market levels (in terms of both absolute prices and valuations) and few clear contrarian opportunities, we spend more time researching ideas rather than investing. In the long run, the market has the wonderful tendency to offer great buying opportunities for those who patiently wait for the right circumstances and price. Thus, we wait.

Yours truly,


François Sicart, Allen Huang & Bogumil Baranowski


Disclosure

This report is not intended to be a client‐specific suitability analysis or recommendation, an offer to participate in any investment, or a recommendation to buy, hold or sell securities. Do not use this report as the sole basis for investment decisions. Do not select an asset class or investment product based on performance alone. Consider all relevant information, including your existing portfolio, investment objectives, risk tolerance, liquidity needs and investment time horizon. This report is for general informational purposes only and is not intended to predict or guarantee the future performance of any individual security, market sector or the markets generally.


WOULD THE REAL ECONOMY PLEASE STAND UP?

“Consumer sentiment in U.S. hovers near highest in 12 years.” This cheerful headline from Bloomberg on January 13 reflects the general tone of the media during the recent “Trump Rally.” At the same time, the Gallup organization reports that “In the US, personal satisfaction [is] back to pre-recession levels.”

But, as John Authers had pointed out in the Financial Times a few days earlier:

Those strong consumer confidence numbers came as the new year dawned with some horrific announcements from the biggest department stores, traditionally the beneficiaries of consumer confidence and also big employers.

Indeed, Macy’s plans to close 100 stores. Sears is shutting 30 Sears and Kmart stores in addition to selling its well-respected Craftsman tool line to raise cash. The list of such announcements is unprecedently large and still growing. Moreover, Morningstar analysts pointed out in October that when an anchor store like Sears or Macy’s closes, that event often triggers “co-tenancy” clauses that allow the remaining mall tenants to terminate their leases or renegotiate terms. This fact supports to Credit Suisse’s estimate that, if Sears continues to close stores, about 200 shopping malls are at risk of shutting down.

It is hard to believe that the trend in retail will not have an impact on U.S. employment and, indeed, on overall consumer behavior.

Consumer optimism at odds with employment statistics

Robert Samuelson explains the apparent contradiction between store closures and consumer optimism in a recent RealClear Markets column (1/12/17):

We have two systems to do one job. Companies have to support the old as well as the new technology. People no longer buy everything in stores, but stores are still necessary. (In 2016, e-commerce totaled [only] about 8% of retail sales.) Still, the loss of sales makes the brick-and-mortar stores less productive, and their loss of productivity offsets some or all of the gains from digital technologies. Macy’s and Sears have to invest in the new technology, even as the value of the old technology erodes.

As I write this report, my partner Bogumil points out that major retailer Target just announced a 3% year-to-year drop in the November/December holiday season store sales while digital sales grew more than 30%. As a result, overall sales for the period declined 1.3%.

Samuelson lists other industries and products where “parallel technologies” compete: smartphones and traditional landlines; paper and digital newspapers; cable TV and streaming internet video, etc.

The fact that structural shifts can make accepted economic statistics and indicators misleading or even obsolete is not a new realization. In what would probably be considered a politically incorrect example today, Nobel Laureate Paul Samuelson often joked that if a man married his maid, GDP would fall because the money earned by the maid had been counted in the GDP, whereas the new wife’s chores would not earn her a salary — so her work would not be counted.

The new economy: highly successful but statistically invisible

In today’s digital economy, official statistics are increasingly misleading because they ignore a growing segment of the economy. Tom Goodwin, strategist for a major marketing/advertising group published a post on TechCrunch entitled “The Battle is for the Customer Interface.” It made the following points:

  • The world’s largest taxi company owns no vehicles (UBER)
  • The world’s most popular media owner creates no content (FACEBOOK)
  • The most valuable retailer has no inventory (ALIBABA)
  • The world’s largest accommodation provider owns no real estate (AIRBNB)

The statistical problem this highlights, according to veteran venture capitalist Bill Davidow, is that we live in two worlds, physical and virtual. (The Atlantic – 07/2014)

In the physical economy, almost every activity is measured in dollars. If more dollars are spent or earned, we conclude that the economy is growing. But this economy is anemic, struggling, biased toward inflation and shrinking.

In the virtual economy, a lot of the services provided to us are free. If we paid dollars for these services, they would be counted as part of the GDP and would add to economic growth. But we don’t, so they are not counted. A pity, because this economy is robust, biased toward deflation, and growing at staggering rates.

Larry Downes explains in the Washington Post (10/24/16) that key economic benchmarks, including the GDP, historically ignore everything without a price! And Edoardo Campanella, in a Project Syndicate article (11/4/16), confirms that national accounts ignore most of the highly valuable services provided for free by tech giants like Wikipedia, Facebook, Twitter or Google.

Is it possible that, broadly speaking, a lag in middle-class incomes is being off-set by a rising standard of living? This would explain the statistical contradictions puzzling observers today. Davidow suggests that many economists, policy makers, and politicians, using 20th-century methods to analyze our 21st-century economy, fail to grasp the situation.

Manufacturing production at odds with manufacturing employment

Another area where assessments of economic health and growth differ widely depending on one’s lens is the manufacturing sector. A typical headline relating to it might be this one from CNNMoney (3/29/16): “U.S. has lost 5 million manufacturing jobs since 2000.”

But, in an op-ed for the Los Angeles Times (8/1/16), Daniel Griswold of George Mason University reminded us that American manufacturing is actually at a peak, not a trough. Industrial production hit a record high just before the Great Recession and is nearing that level again.

The apparent contradiction stems from the fact that, while U.S. factories are about 2.5 times as productive as they were in the early 1970s, this massive expansion in output was achieved with fewer and fewer workers.  According to government data, manufacturing employment has fallen from 19 million in 1970 to about 12 million today.

This is how Daniel Gross, executive editor of Strategy+Business, explains the discrepancy:

First, the production of less-expensive goods, like T-shirts, toys, and the like, has long since gone offshore. As a result, manufacturing in the US is disproportionally a high-end activity: heavy machinery, tools, cars, jets.

Second, there’s productivity. Manufacturing’s constant efforts to produce more (and faster) with fewer resources – raw materials, energy, effort, and, yes, labor…

Third, in the digital age, manufacturing incorporates a growing proportion of services input; today, more “manufacturing tasks” are performed by people who do not work directly at manufacturers. So, manufacturing probably supports more employment than people think.

According to Alana Semuels (The Atlantic 1/6/17), manufacturing still makes up about 12.5% of America’s GDP, the same as it did in 1960, but with proportionally fewer people. As a result of this trend, the average factory worker now makes $180,000 of goods every year, more than three times what he or she produced as recently as 1978.

Also as a result of this transformation, the average manufacturing worker now makes $26 an hour (nearly $50,000/year, if my math and assumptions are correct). Since 2000, manufacturing jobs for people with graduate degrees have grown by 32%, while those for people with less than a high-school education fell by 44% (between 2000 and 2013). Michael Hicks, of Ball State University, concludes: “We’ve lost the bad-paying jobs to China and gained good-paying jobs.”

Is the trade deficit a measure of the economy’s dynamism?

Today’s economic models — and the institutions using them for forecasting and policy-making –rely on a built-in theory of the economy which enables them to “assume” certain relationships. According to Robert Skidelsky (Project Syndicate -12/19/12), it is among these “assumptions” that the source of recurring errors in economic analysis and forecasting can be found.

In the “prehistoric” times when I learned economics in business school, one of these assumptions was that when a country incurs a trade deficit with the rest of the world by selling fewer goods and services abroad than it buys, it must make up that deficit by borrowing or somehow attracting an equivalent amount of capital from other countries. Since then, the frantic globalization and financialization of the world economy have turned this assumption on its head.

Today, the vast number of financial transactions between countries dwarfs the value of international trade in goods and services. My own observation is that international capital is attracted to a country either by higher interest rates, attractive investment opportunities or safety considerations.

When the amount of capital flowing into a country increases, consumption and investment in that country rise, leading to increased imports – especially since, as a result of the capital inflows, the local currency generally has appreciated. Since exports are not increased at the same time, and may in fact be reduced by the currency’s appreciation, the country’s trade balance deteriorates toward deficit.

In the last 6 years, American imports have exceeded exports by about $500 billion a year. In the same time, Net Foreign Ownership of American capital assets has risen by an average of $900 billion per annum – nearly double the pace of the trade deficit growth.

Gregory Mankiw, professor of economics at Harvard concludes that, rather than reflecting the failure of economic policy, the trade deficit may be better viewed as a sign of success. As such, he argues that if President Trump wants to restore growth, focusing on the trade deficit may not be the best way to achieve it.

There is an additional way in which trade statistics may be a poor guide for policy-making. According to Mark Perry, scholar at the AEI and professor at the University of Michigan, “Importers are exporters and exporters are importers” (AEIdeas — 1/6/17).

According to The Economist, every $100 of goods the United States imports from Mexico contains $40 of goods that it had previously exported to Mexico and that are embedded within the products returning as imports. Meanwhile, the Wall Street Journal reports that the 2017 Chevy Cruz actually contains a large foreign content (56%) whereas, year after year, Toyota and Honda have dominated the rankings of the most “American-made” cars.

The inflation dichotomy.

As the chart below illustrates, inflation is another widely-watched statistic that may explain why some consumers feel more comfortable than others. Commenting on this AEI chart, Christopher Ingraham of Wonkblog wrote: “The stuff we really need is getting more expensive. Other stuff is getting cheaper.”

AEI Scholar Mark Perry, reminding us that many of today’s statistical distortions are related, points out that many of the items falling in price are manufactured goods. Many of these manufactured goods, like TVs and appliances, come from overseas, where labor costs are cheaper.

On the flip side, he says, goods like education and medical care can’t be produced in a factory, so trade-related pressures do not apply.

Chart Real Economy

Sources: American Enterprise Institute; Bureau of Labor Statistics

Further complicating the measurement of inflation’s impact on households is the fact that– through private and public insurance or other forms of assistance –  many Americans are insulated from the full cost of the services with the fastest price inflation. Unfortunately,  others are not.

Not surprisingly, the arms of government which, like the Federal Reserve, dispose of a single tool (like the supply of money) to regulate a diverse economy, are in the position of a car-owner trying to fine-tune a carburetor while wearing boxing gloves. Other government agencies that, in theory, dispose of a more diverse arsenal of policy tools, are often paralyzed by lobbies and other political considerations. In politics, acknowledging that problems are complex does not get as many votes as oversimplifying slogans.

Faced with this confused and confusing policy environment, what should investors do?

This a question that I will attempt to answer in my next article.

François Sicart

January 23, 2017

Disclosure

 This report is not intended to be a client‐specific suitability analysis or recommendation, an offer to participate in any investment, or a recommendation to buy, hold or sell securities. Do not use this report as the sole basis for investment decisions. Do not select an asset class or investment product based on performance alone. Consider all relevant information, including your existing portfolio, investment objectives, risk tolerance, liquidity needs and investment time horizon.. This report is for general informational purposes only and is not intended to predict or guarantee the future performance of any individual security, market sector or the markets generally.

December 2016 Monthly Letter

The last few weeks following a surprise outcome of US presidential elections had a meaningful impact on the market. Half of the gains came from financials, the rest from energy, industrials, materials. The markets are hoping for looser regulatory restrictions for banks, and faster growing economy.

After nine years of record low and unchanged rates (federal fund rate of 0-0.25%), we saw the first increase in December last year (to 0.25-0.50%). A year later, this December, the Federal Reserve increased the rate by another 25 points (federal funds rate 0.50%-0.75%), and expects a 75 point increase through 2017, which is a faster pace that previously projected. The Fed is more confident in the progress the economy is making, and it is seeing strong labor market, and inflation picking up.

With rates going up, bond prices have come under pressure, and we believe it’s only the beginning. Mr. Trump’s high spend fiscal policies re-ignited fears of a potential acceleration in inflation, which support further rate increase. Thus, a long running bull market in bonds has finally come to an end.

Initially, since the money has to go somewhere, equities have been the obvious alternative to declining bonds, but caution is warranted in view of already elevated valuations, prices, and record highs.

Meanwhile, weaker growth in Japan, China, and Europe, and relatively healthy economic growth in the US have helped the dollar, where our portfolios have had the largest exposure. Rising interest rates tend to make the dollar more attractive, and since the new US president is expected to boost growth further, at least initially, further support to the dollar would not be surprising.

After a strong recovery from multi-year lows, gold has been under pressure starting last summer. This is not surprising since a stronger dollar and increasing interest rates make gold less attractive. While, for now, the investment argument in favor of gold is less compelling, we have always viewed gold as an insurance premium against unforeseen crises and the nature of insurance premiums is to cost money when things go well.

Two sectors deserve special comments: biotech and energy

Our biotech/pharmaceutics holdings had a particularly strong few weeks after Trump was elected as the next U.S. president.   The sector itself had been lackluster year to date, amid fear of government mandated price control on drugs.  While we are hopeful that the current political environment would give the sector some tailwind, our reason for keeping or reinforcing our specific biotech holdings is that we remain enthusiastic at their prospects for the next several years.

The energy sector has been undergoing exactly what we had expected, with energy price gradually shifting upwards.  Our view is that the energy sector’s turn has begun and, as a typical cyclical industry, it will have another few years of strong prospect before the market enthusiasm peaks.  Our exploration and production names have already gone up more up 50% year to date.  The service providers will follow, which is typical in this industry, as the energy price rebalance plays out in the next 1-2 years.

In a broader perspective, disciplined contrarian investors may have trouble finding compelling investments in the current environment. The majority of the stocks are close to their all-time highs, and those that are down tend to have some major issues that make them too risky to consider. With very few immediately actionable ideas, we focus on building our wish lists, and holding a higher than usual cash position as dry powder. Meanwhile, we believe that our energy and healthcare holdings leave us well positioned for the current market backdrop.

François Sicart, Allen Huang, Bogumil Baranowski


This presentation and its content are for informational and educational purposes only and should not be used as the basis for any investment decision. The information contained herein is based on publicly available sources believed to be reliable but not a representation, expressed or implied, as to its accuracy, completeness or correctness. No information available through this communication is intended or should be construed as any advice, recommendation or endorsement from us as to any legal, tax, investment or other matters, nor shall be considered a solicitation or offer to buy or sell any security, future, option or other financial instrument or to offer or provide any investment advice or service to any person in any jurisdiction. Nothing contained in this communication constitutes investment advice or offers any opinion with respect to the suitability of any security, and has no regard to the specific investment objectives, financial situation and particular needs of any specific recipient. Any reference to a specific company is for illustrative purposes and not a recommendation to buy or sell the securities of such company.

With Nothing New To Buy Baby Boomers Are Ready To Cash Out

Insatiable appetite for stocks (over-sized demand) driven by baby boomers funding their retirement accounts has boosted the stock market for decades. Now a dry spell in new IPOs (shrinking supply) has helped propel stocks even higher to historic levels. Both of those trends are about to reverse. Baby boomers have already started upping their retirement account withdrawals (falling demand), and pent-up supply of innovation may inundate the market with a fresh wave of IPOs in the years to come.

We have just lived through historically unique circumstances

We already have pointed out some big macro trends that have supported the financial markets for years and are bound to turn in coming years. In particular, economic growth, almost everywhere, has been aided by swelling government debt. We can think of it as “borrowed growth,” facilitated by a decline of interest rates to record-low levels and excessively easy money policies driving market valuations higher.

All of those factors are at historic extremes, and have less and less room to continue in the current direction. Although these forces may already have run their course, momentum has helped propel the market ever higher despite five consecutive quarters when the S&P 500’s earnings declined — the longest such run since the Great Recession (just interrupted by anemic growth in q3 2016).

That’s not the whole story though.

Bull markets
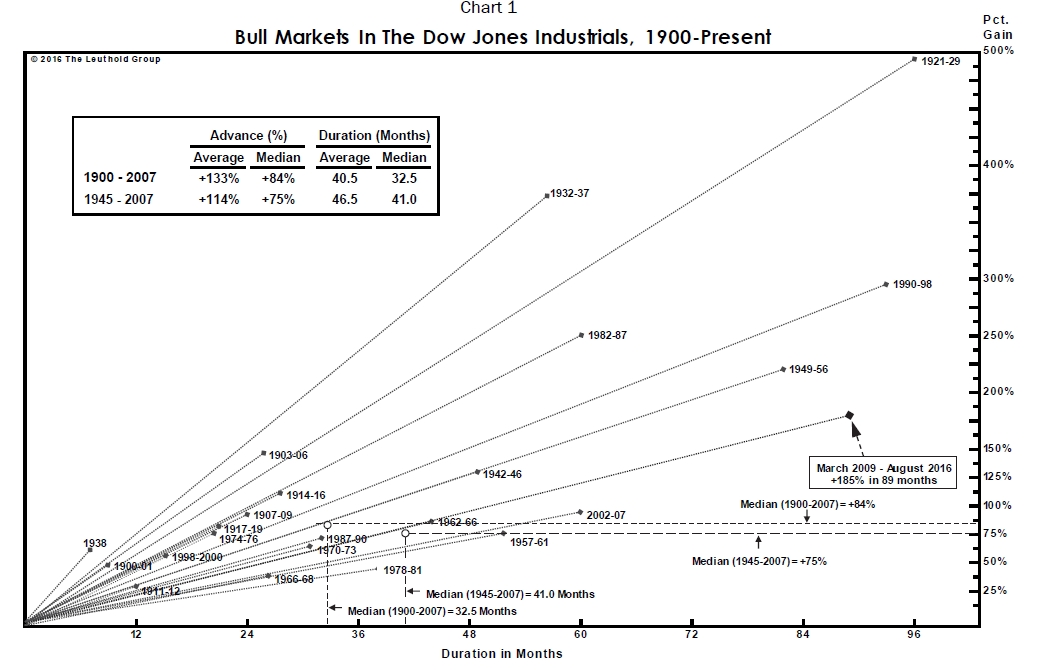
Source: The Leuthold Group

The demographics at work – baby boomers in shopping mode

The stock market, like any free market, is driven by supply and demand. Who are those buyers of all the stocks, bonds, etc.? Are they the 20-year-olds looking for their first apartment with few roommates, often burdened with car loans, credit card loans, student loans? Are they the 30-year-olds with kids at school and a second mortgage? Probably not. They tend to be older, more established, and getting closer to retirement – the famed baby boomer generation. Their earnings power is at its peak, and they are taking advantage of all possible tax deferred retirement plans. They are on the demand side, and the numbers are staggering! We are talking about more the $14 trillion stashed away in traditional IRAs and 401(k) plans alone according to Time.com (1). The amount saved outside of the retirement plans could put the total even higher. Is that meaningful? The US stock market is worth over $20 trillion, and US bond market around $40 trillion, while baby boomers hold half of the assets according to the Congressional Budget Office. It’s not only a US story. The Telegraph quotes Pinch, a book by David Willets, which claims that half of Britain’s wealth is owned by baby boomers, (2). The majority is owned by those over 65.

Baby boomer retiring

Source: Wall Street Journal

The biggest shift in demand has already began

We know now who the buyers have been historically.  What we are curious to know is whether they plan to remain buyers for long. Between 1946 and 1964, 78 million people were born in the US, and they started turning 70 this year. When they retire, they stop saving, and start living off their retirement nest eggs. Is it already happening? The Wall Street Journal in mid-2015 reported that 2013 was the first year when investors pulled more money out of tax deferred accounts than they put in —  $11.4 billion, to be exact vs. $12 to $22 billion net contributions in previous years (3). That trend will only accelerate in coming years. The article mentions that the outflows will continue through 2030, after peaking in 2019. Needless to say, with the market at record highs and of the biggest bull markets behind us, this may be a compelling time to increase those withdrawals.

Withdrawals 401k

Source: Wall Street Journal

Even if they are not sellers, baby boomers grow increasingly conservative

We might be enjoying what will soon be the longest-ever bull market (yes, we are catching up with bull markets of the 1990s and 1920s!), but the baby boomer generation has recently witnessed some major downturns in the market. Memories of the 2008/2009 recession, and the biggest market sell-offs in decades are still fresh. Similarly, the burst internet bubble of the late 1990s alarmed many investors, and hasn’t been forgotten yet. Needless to say, the closer we get to retirement, the more conservative we become — as we should. Our investment horizon shrinks, and we care less about doubling our assets over the next 5-10 years than about keeping enough to cover our growing expenses. With that in mind, we should expect baby boomers to move away from stocks, and increase their bond and cash holdings to reduce exposure in case of a market sell-off. This doesn’t bode well for the stock market, does it?

What about the supply? We know there are buyers, but has there been enough to buy?

Every two weeks, over 150 million people in the US (working full-time and part-time) receive a paycheck. Many automatically deduct and put some cash away in their IRAs and 401(k)s to invest in increasingly passive investment funds. In effect, they buy a little bit of almost anything out there that is publicly traded, and large enough to be bought in big quantities.

Dry spell on the tech IPO front

To satisfy that investing appetite, we’d need more new companies of size going public, but where have they been lately? The number of US IPOs (“Initial Public Offerings”) has fallen to the lowest level in 7 years, according to FactSet.  Some blame market volatility, some poor performance of previous IPOs. If we look at emerging tech IPOs, CNBC reported in October that 2016 is the weakest year for that category since the financial crisis, and potentially second slowest for venture-backed companies since 1980 (4). There are no big billion-dollar tech IPOs on the horizon. As an example, Uber and Airbnb are enjoying high valuations and unlimited private capital, and are in no rush to go public.

No IPOs and venture capital crashing

According to CNBC, first quarter of 2016 saw a 25% drop in VC funding, the steepest decline since the dot-com bust in early 2000s. (5) With smaller pipeline of VC-funded start-ups, the near-term prospects for tech IPOs don’t look much better. At Sicart Associates, we never rush to buy hot IPOs, preferring to see them prove themselves before we step in. With limited supply of new companies though, we are experiencing a shortage of newer businesses to choose from.

Innovators with grey hair

Not long ago I was having a quick lunch between dives in Antigua and admiring some oversized yachts in the marina, when someone told me that the biggest one belonged to the creator of Excel. I thought to myself – Excel? That’s not exactly the hottest, newest invention of the day.

But neither are the tech companies that get all the attention and trade at all-time highs these days! Apple and Microsoft are 40 years old, which means they were around before parents of most millennials even met. Amazon and Netflix are over 20 years old, Google is not far behind. Facebook is 12. They all innovate and continue to change our lives, but they are by no means new to the game. Instead, these few highly prized companies focus on trying to prove they can still grow despite their maturity and immense size. Investors seem to be following along for lack of other compelling tech options.

Has innovation taken a pause then?

So on the one hand, former innovators are decades-old companies now.   On the other hand, attractive new business is scarce, constrained by a slump in the VC market, a weak IPO backdrop, and concentration of funding on the so-called billion dollar unicorns. You could conclude that innovation has never been weaker, especially when you look at the productivity growth which is usually driven by innovation. According to official labor statistics, 2011-2015 has been a five-year span with the slowest annual output per hour of work growth since 1977-1982 — far below the 1950s.

Productivity

Source: Labor Department

“The idea that innovation is slowing down is… stupid” – Bill Gates

Yet what may seem like pauses in IPO activity and productivity growth may be deceptive, masking the pace of true innovation whose benefits we are yet to see. The current dry spell for IPOs and headwinds for VCs may be coming to an end.

In an interview in The Atlantic (6), Bill Gates said: “I want to meet this guy who sees a pause in innovation and ask them where have they been. The pace of innovation today is faster than ever.” He also reminds us that when innovation is happening fast enough, it sometimes shrinks GDP by disrupting industries (example: the Internet damaging the newspaper industry) or increasing costs (example: medical technology).

“Take the potential of how we generate energy, the potential of how we design materials, the potential of how we create medicines, the potential of how we educate people, the way we use virtual reality to make it so you don’t have to travel as much or you get fun experiences,” Bill Gates added.

Rosy future for innovation

Artificial intelligence, automation, genetics – these are all fields booming with innovation. The Wall Street Journal reports that “science is stepping up the pace of innovation” (7).

Meanwhile World Economic Forum reports that “the world is about to experience an exponential rate of change through the rise of software and services.” (8) WEF further identifies six megatrends:

–people and the internet (wearable and implantable technologies will enhance people’s “digital presence” allowing them to interact with objects and one another in new ways)

–computing, communications and storage everywhere (this will lead to ubiquitous computing power being available, where everyone has access to a supercomputer in their pocket, with nearly unlimited storage capacity)

–the internet of things (smaller, cheaper, smarter sensors at home, in clothes, cities, transportation etc.)

–artificial intelligence and big data (with more data software can learn and evolve, and help with decision making)

–the sharing economy and distributed trust (assets can be shared, which leads to new efficiencies),

–and finally digitization of matter (physical objects can be printed which transforms industrial manufacturing and creates new opportunities).

WEF industry insiders’ survey tells us that tipping points in each of 21 identified transitions will occur in the next 10 years – among them is the first artificial intelligence machine on a corporate board.

If that’s the case, the next 10-20 years seem far more promising for venture capital, IPOs, and public investors looking for new investment opportunities.

 Conclusions

With the early 21st century’s longstanding bull market moving around to the rear-view mirror, this may be a good time for reflection on the long-term dynamics driving the appetite for stocks and their prices.

Baby boomers’ long-term appetite for stocks and the shortage of big IPOs may have boosted the markets beyond the obvious macro tailwinds. Both those trends are about to reverse. Baby boomers will be cashing out, while a pick-up in innovation may translate to a new wave of IPOs.

As contrarian investors we pride ourselves on pointing out major shifts in long-term trends. These are two that might define the investment backdrop for the next 5-10-20 years.

Perhaps there is a silver lining behind those two reversing trends. With more subdued demand, and probably more abundant supply of new companies, we might be finding more of what we are always looking for: promising investments at attractive prices.

Bogumil Baranowski – December 12th, 2016

References:

  1. “Why a $2 Trillion Tax Bill Is Coming Due for Baby Boomers” (Times.com, June 27, 2016)
  2. “Baby-boomers own half of Britain’s wealth” (The Telegraph, January 27th, 2010)
  3. “Money Flows Out of 401(k) Plans as Baby Boomers Age; Withdrawals from 401(k) retirement plans exceed new contributions, a shift that could shake up U.S. retirement industry” By Kirsten Grind (WSJ, June 15, 2015)
  4. “Why you shouldn’t expect any more billion dollar tech IPOs anytime soon” (CNBC, October 7th, 2016)
  5. “Venture funding for startups just suffered the biggest crash since the dot-com bust” (CNBC, April 14, 2016)
  6. “Bill Gates: ‘The Idea That Innovation Is Slowing Down Is … Stupid’; New ideas are coming at “a scarily fast pace,” (The Atlantic, March, 12th, 2014)
  7. “Science Is Stepping Up the Pace of Innovation – Big advances in astronomy and genetics” by Alison Gopnik (WSJ, Jan 1, 2016).
  8. Deep Shift Technology Tipping Points and Societal Impact, World Economic Forum Report, September, 2015.


This presentation and its content are for informational and educational purposes only and should not be used as the basis for any investment decision. The information contained herein is based on publicly available sources believed to be reliable but not a representation, expressed or implied, as to its accuracy, completeness or correctness. No information available through this communication is intended or should be construed as any advice, recommendation or endorsement from us as to any legal, tax, investment or other matters, nor shall be considered a solicitation or offer to buy or sell any security, future, option or other financial instrument or to offer or provide any investment advice or service to any person in any jurisdiction. Nothing contained in this communication constitutes investment advice or offers any opinion with respect to the suitability of any security, and has no regard to the specific investment objectives, financial situation and particular needs of any specific recipient. Any reference to a specific company is for illustrative purposes and not a recommendation to buy or sell the securities of such company.

Between Inflation and Deflation

The 1970s and early 1980s were years of turmoil. From 1963 to 1969, US President Lyndon Johnson had pursued “Guns and Butter” policies that simultaneously financed an escalating war in Vietnam and his “Great Society” welfare programs at home. Boosted by these expenditures, the economy seemed to boom. However, after a long period when the absence of recession had convinced many economists that the economic cycle had been conquered, the United States experienced a first, relatively mild, recession in 1970.

Inflation 1

President Richard Nixon thus inherited an economy entering recession and, to maintain the stimulus, he initially followed the same policies as his predecessor.

By 1971, however, America’s bloating twin deficits (budget and trade) had made it impossible to maintain the existing system of fixed exchange rates based on a US dollar theoretically convertible into gold.

That system had maintained an artificially high exchange rate for the dollar which, in turn, had helped to hold inflation in check. Once President Nixon ended the dollar’s convertibility into gold, the so-called Bretton Woods system collapsed, to give place in 1973 to a new system of floating exchange rates. As can be seen below, the dollar lost more than 50% of its value against the Deutschemark between 1972 and 1980.

Inflation 2

As a result of lax US economic policies, the first signs of inflation actually had begun to appear as early as the late 1960s. But the dollar’s collapse aggravated the tendency and, since oil is priced in dollars, this probably was a factor in OPEC’s October 1973 decision to declare an embargo and to triple the price of oil practically overnight. With this last blow, inflation surged from an annual rate of 3% in 1972 to over 12% in 1974.

Inflation 3

The surge in the prices of oil and other commodities not only triggered overall inflation but, aggravated by OPEC’s difficulty in recycling to the rest of the world their sudden dollar influx from oil exports, also acted as a severe tax and liquidity strain on the world economy. This triggered a recession in 1975, which not only was severe but, for the first time, was also truly global.

Then, after only three years of economic recovery, an Islamic revolution deposed the Shah of Iran in 1979 and triggered a war between Iraq and Iran that lasted from 1980 to 1988. Initially at least, this conflict reduced the flow of oil from both countries and triggered the Second Oil Shock.

Inflation 4

At first glance, the recession that ensued from the second oil shock in 1980, looks very short and relatively mild on economic charts. But that is due mainly to a mini spending boom on oil equipment and exploration, which only lasted three quarters in 1981. After that spike, it should be noted, oil prices declined for 18 years and the need for oil-related capital spending seemed less urgent.

Thus, the entire period 1980-1982 should really be viewed as a one of the longest and most severe recessions in history.

Around the middle of the long, crisis-laden period between the late 1960s and the early 1980s, I wrote for my firm, Tucker Anthony, a paper entitled “Between Inflation and Deflation: The Dislocating World Economy”. The paper described the conflicting forces of inflation and deflation shaping the emerging post-Bretton Woods and post-OPEC economies.

It is entirely possible that President-elect Donald Trump will inherit a situation just as problematic as Richard Nixon did in 1969 – at least from an economic point of view.

While no one knows much about his detailed economic agenda beyond campaign slogans, there is a good chance that US international relations during his tenure will be more confrontational and, on the trade front, more mercantilist and protectionist than in the last few decades.

Trade is not a zero-sum game and if the United States manages to import less, it is likely that other countries or blocs will either retaliate or pursue similarly restrictive policies. Historically, periods like this have resulted in downward spirals for world trade. In turn, periods of slowing or declining world trade seem have caused a slowdown in global economic growth.

The above comments derive from my personal experience but in today’s New York Times, Ruchir Sharma, chief global strategist at Morgan Stanley Investment Management, pens an editorial drawing another striking and scary parallel: the period of de-globalization that started with the outbreak of World War I, in 1914.

Following four decades of rising migration and trade, that period of de-globalization encompassed the 1920s, 1930s and early 1940s. As Sharma points out, “National economies move from boom to bust in cycles that last a few years but… the flow of goods, money and people across borders has advanced and retreated in decades-long waves.”  (When Borders Close, New York Times, 11/12/06)

Many regions of the globe are still fighting the consequences of the financial crisis and Great Recession of 2007-2009. Recoveries have remained subdued and uneven. Even in the United States, which by all accounts has had the strongest economy, the recent elections seem to indicate that not everyone feels that they are sharing in the improvement depicted by recent statistics on employment and wages. The allure of protectionism is growing.

Sharma argues that the more recent globalization boom, which gained momentum in the 1980s, has been in a retreat that began in 2008 and is still accelerating, with anti-globalization populists having already won control in Britain and gaining momentum in Italy, France and Germany. The likely fallout, he argues, is “slower growth, inflation and rising conflict”.

“History doesn’t repeat itself but it often rhymes”, as Mark Twain may have said. Today’s rising protectionist tendencies around the world can only be intensified by Donald Trump’s promised tough approach to international trade and must be counted as a recessionary force in the global outlook.

Domestically, to fight any recessionary tendencies and provide employment to those left behind by the more dynamic but increasingly intangible and global economy, Mr. Trump has indicated that he favored fiscal (budgetary) spending and investment over the recent monetary experiments of the Federal Reserve, which he has found ineffective. Tax cuts and spending on infrastructure construction and repair, which will create jobs in older industries, are likely to be favored.

While there are arguments in favor of Mr. Trump’s preferred fiscal approach, it also faces potential challenges.

First of all, there necessarily will be a time lag between immediate increases in government expenditures or tax cuts and any resulting revenue gains from higher economic growth. In the meantime, it will appear as if the Federal deficit, already large, is bulging further and boosting the already worrying level of Federal debt. I think we can trust the media and the usual pundits to claim early that the new policies are either not working or fraught with dangers.

Second, although all sectors and regions are not participating fully, the US economy has been relatively strong. Overall, unemployment is low and wages have recently been increasing. In fact, after much debate and hesitation and presumably remembering William McChesney Martin’s admonition that the role of the central bank is to take away the punch bowl when the party gets going, the Federal Reserve seemed ready to increase interest rates even before the recent elections.

Since some of Mr. Trump’s early proposals are aimed at stimulating some of the economy’s areas that have been lagging, the result is likely to be some acceleration of inflation. Interest rates, which have been suppressed by the Federal Reserve are likely to rise, with the consequences that we discussed in our September paper (http://sicartassociates.com/baby-boom-investors-genius-or-just-lucky/)

Note, however, that monetary and fiscal policies are not independent from each other. A rise of interest rates from today’s very low levels will necessarily increase interest payments on the Federal Debt, which already constitute one of the largest expenditures of the Federal Budget.

Another economic uncertainty is the fate of the US Dollar. At the moment, the consensus of professionals seems to anticipate a strong dollar, reminiscent of its performance in the early Reagan years. In this view, fiscal stimulus and a somewhat less accommodating monetary policy in the United States (with the resulting higher interest rates) on the one hand, and weak economies and continued monetary easing in Europe and Japan on the other, justify a run-up in the US dollar.

In our view, the likelihood of more protectionist and mercantilist trade policies may lessen the prospects for this scenario. The volume of international trade, nowadays, is dwarfed by the volume of international capital flows, and investment incentives play the greater role in attracting or discouraging capital. Initially, Mr. Trump’s promise of a tax break on the repatriation of corporate holdings held overseas may give a boost to the consensus scenario. But thereafter, the outlook for a closed American economy in conflict with various trading partners may temper that early enthusiasm.

No matter who won the elections, the task of the new President was bound to prove very challenging, starting at the end of a long period of declining interest rates and probably on the eve of a long period of rising interest rates. The continued conflict between the forces of inflation and recession will likely intensify somewhat under a trump presidency and we believe that keeping ample cash reserves remains the wise position for investors, especially at current valuation levels.

François Sicart – November 14, 2016

This presentation and its content are for informational and educational purposes only and should not be used as the basis for any investment decision. The information contained herein is based on publicly available sources believed to be reliable but not a representation, expressed or implied, as to its accuracy, completeness or correctness. No information available through this communication is intended or should be construed as any advice, recommendation or endorsement from us as to any legal, tax, investment or other matters, nor shall be considered a solicitation or offer to buy or sell any security, future, option or other financial instrument or to offer or provide any investment advice or service to any person in any jurisdiction. Nothing contained in this communication constitutes investment advice or offers any opinion with respect to the suitability of any security, and has no regard to the specific investment objectives, financial situation and particular needs of any specific recipient.

Baby Boom Investors: Geniuses or Just Lucky?

A bull market makes every investor a genius — while it lasts

I founded Tocqueville Asset Management in 1985, with what turned out to be incredibly good timing. Since then, the S&P 500 index of the US stock market has risen from 210 to almost 2,200 — a more than ten-fold appreciation in just over 30 years. Admittedly that rise was punctuated by some scary episodes. Nevertheless it resulted in an annual compound rate of nearly 8%. If we include dividends, as is the recommended practice, the compound, annual “total return” from stocks over the period was in excess of 10% per annum.

S&P 500 (SP50-USA)
Source: Invextext

One factor in that performance was a steady decline of interest rates, which boosted stock prices along with bond prices. According to Bill Gross of Janus Capital, the price of investment-grade US bonds produced an average compound rate of return of 7.47% since 1976.

As a result, many baby-boomers pride themselves on investment performances that seem to prove their acumen while in fact, their secret is simply fortuitous timing. An old stock market truism: “It’s better to be lucky than smart.”

Unfortunately, entrepreneurs who start out as financial advisors today may not prove as lucky as I was in 1985. The mere fact that the percentage of US GDP attributable to asset management has been multiplied by ten since 1980 should serve as a contrarian warning.1 Popularity of a concept or an activity is seldom a good sign: I like to remind budding financial entrepreneurs of Howard Marks’ observation that in the ’70s, there were 10 hedge funds run by 10 geniuses; in 2004, there were 5,000 hedge funds, and he didn’t think that they were run by 5,000 geniuses. Today there are probably 10,000 or so hedge funds.2

S&P 500 (SP50-USA)
Source: Federal Reserve; Bureau of Labor Statistics; A. Gary Shilling

Sailing against the wind is not the same as sailing with the wind at your back

As we see in the graph above, the steady decline of interest rates in the last 30-plus years was preceded by an equally long period of rising interest rates, which peaked at 15% in the early 1980s. But who remembers that? Not most baby boomers. Investors who started their careers in the early 1980s, when interest rates began their long descent, would be approaching retirement today. For younger ones, what preceded is history and does not shape reflexes and behavior in the same way as direct experience.

In that respect, at least, I am fortunate to have started working on Wall Street in 1969. Many of the portfolios I analyzed back then contained long-term bonds purchased after World War II at very low yields. By 1969, many were selling for around 50 cents on the dollar and were mostly useful for generating tax losses to offset the capital gains on our stock portfolios. I never forgot that, and it did shape my reflexes and behavior for the long term.

Given today’s ultra-low interest rates, Bill Gross estimates that yields would have to drop to minus 17% in order for the bond market to match its return of the last 40 years! There does not seem to be much chance of this happening. Perhaps instead we should brace ourselves for the mirror image of the recent era of declining rates.

Sustained low interest rates change our economic behavior

Lower interest rates make borrowing cheaper and easier. In the early stages of an economic cycle, this dynamic will normally stimulate a recovery by providing incentive to spend and invest. However in the long uneven recovery from the 2007-2009 recession the US Federal Reserve (followed later by other major central banks) resorted to more desperate measures. These included zero interest rates policies (ZIRP), quantitative easing, and negative interest rates – policies which are collectively known as financial repression.

After years of interest rates being artificially repressed, the behavior of economic agents has altered: we increasingly act as if interest rates would remain low forever. In short, a new complacency about the current abnormal state of affairs has set in.

The first, dramatic consequences of “preventive” easy money were observed as early as 2007 in the private banking sector, with the bursting of the sub-prime lending bubble and its catastrophic results. But more recently, the stubbornness of central banks in repressing interest rates seem to be creating a bubble the world’s bond markets. So far, investors are merely enjoying the ride, thinking they are coping well with a difficult environment. But painless excesses seldom come to a painless resolution.

Harvard University’s Kenneth Rogoff describes the current situation as follows:

The US Treasury and the Federal Reserve Board, acting in combination, have worked to keep down long-term government debt, in order to reduce interest rates for the private sector. At this point, the average duration of US debt (integrating the Fed’s balance sheet) is under three years… Given that the interest rate on 30-year US debt is roughly 200 basis points higher than on one-year debt, short-term borrowing has saved the government money as well… [But] The potential fiscal costs of a fast upward shift in interest rates could be massive. If the US ever did face an abrupt normalization of interest rates, it could require significant tax and spending adjustments.3

I believe that a majority of investors is ready to acknowledge such a scenario in theory but that as consumers, businesspeople and taxpayers, few are prepared to adapt to such a change if it becomes reality.

Impact of low interest rates on the stock market

The tendency of stock valuations (Price/Earnings, or P/E, ratios) to rise when interest rates go down has been well documented and makes intuitive sense. Stocks compete with bills and bonds for investors’ money and when interest rates earned on bills and bonds decline, the relative attractiveness of stocks improves, raising P/E ratios.

Corporate profits, while cyclical, tend to grow rather steadily over the years. The main difference between major bull and bear markets really comes from changes in P/E ratios. As can be seen below, P/E ratios have been the main force at the back of the major bull market of the last 30-plus years.

[In the graph, the P/E ratio has been replaced by its inverse, the earnings yield (E/P %) to better illustrate the relationship with interest rates.]

S&P 500 (SP50-USA)
Source: The Economic Report of the President

With today’s interest rates in major markets hovering around zero, it is not surprising that, depending on the index used, global P/E ratios are somewhere between above-average and very expensive historically. Without making specific predictions, it is prudent to be prepared for a normalization of interest rates someday.

If lower interest rates boost the price of bonds, stocks (P/E ratios), real estate, art and (as a result of the so-called “wealth effect”) our propensity to spend, what do we think will happen when they rise again?

Desperate monetary policies trigger a desperate quest for returns

The reduced income available from bonds and other fixed income instruments is changing investors’ attitudes. There are indications that many, deprived by the low interest rate environment of their traditional income-producing investments, are assuming increased risk – sometimes to foolish levels – to try and improve their total returns.

The anguish of retirees who depend on fixed-income portfolios to meet their living expenses is readily understandable. But this phenomenon also affects the beneficiaries of many older pension funds, whose employers are still assuming that the future overall return on their pension portfolio will be 7% per annum. In fact, the income on the bond portion of these portfolios should trend closer to zero as maturing, older bonds, are replaced by lower-yielding new ones. Meanwhile, a number of models predict that stocks in general cannot exceed a 5-6% total return annually over the next 10 years, given today’s extended valuations. So it is very likely that the actuarial assumptions underlying many pension plans are unrealistic and that the companies or state entities that sponsored them will have to fund their pension obligations from their own pockets (or, more likely, from those of their shareholders or taxpayers).

As I write this, Business Insider reports on “a company with no revenue, $1,000 in the bank, and a $35 billion market cap” which is now under investigation by the SEC “because of concerns regarding the accuracy and adequacy of information in the marketplace… ”

There will always be gullible people ready to invest blindly in a “story.” In recent years some global companies have taken advantage of low interest rates to issue record levels of perpetual debt, i.e. debt that never needs to be repaid. Bonds of such companies thus may never return to their issue price.

At the same time, the value of negative-yielding bonds issued globally — primarily government bonds in Europe and Japan, but also a mounting number of highly-rated corporate bonds — has now reached $13.4 trillion. The German government recently issued 10-year notes with a negative yield of 0.5%. Buyers will receive zero interest for ten years and at maturity will only be repaid 0.995 cents on the dollar.3

No wonder Leon Cooperman, of Omega Advisors, likens buying bonds today to “walking in front of a steamroller to pick up a dime”4, while The Interest Rate Observer’s James Grant observes that insurance companies which invest their premiums in fixed income are “dying on the vine.” 5

Sidney Homer and Richard Sylla, the authors of A History of Interest Rates, found no instance of negative interest rates in 5,000 years. 6 I can easily understand how attractive it is for corporations or governments to borrow under today’s unique conditions. But my questions are: “Who in the world is buying these certificates of guaranteed confiscation?” and, if not: “What risks are investors accepting to try and match their obsolete income expectations?”

Reckoning delayed: complacency is not justified

One of my concerns about the near-term future is that many of the excesses we are witnessing seem painless. For example, even though the US government has issued $8 trillion of new debt since the financial crisis, its interest rate costs are lower than before the crisis: as debt has doubled, the rate of interest has halved, helping keep the government budget deficit (and our taxes) in check. So far: no pain, all relief.

In the private sector, more debt can be undertaken on houses at historically low rates so that the monthly interest payments on mortgages are painlessly low. But debt is debt and someday, the principal of the loan will become due.

In many other areas, current incomes are similarly sustained or even enhanced at the expense of deteriorating balance sheets. For example, many companies periodically buy back blocks of their own shares to support stock prices. They thus also increase reported earnings per share by reducing the number of shares outstanding. On the balance sheet, however, this strategy reduces the company’s cash and, importantly, the shareholders’ equity. Some companies are taking further advantage of suppressed interest rates by actually borrowing to repurchase their shares in the market, thus boosting stock prices (instant pleasure) at the expense of their balance sheets (future pain).

Finally, as always when central bank money is plentiful, private pockets of speculation have also developed. Unicorns is the new name for privately-held, often profitless startups “Uber-valued” at $1 billion or more. Business Insider counts 143 such unicorns today, compared to 45 two years ago. All or most are looking to go public, constituting a potential $513 billion new supply overhanging the stock market. But, if early Facebook investor Jim Breyer is right in thinking that 90% of these unicorn startups will be repriced or die, this might also constitute a new supply of disappointments. 7,8

On the whole, the current environment can be better described as one of self-satisfied complacency than as one of irrational exuberance. With very few alternatives to generate positive returns, many investors choose to remain fully invested in stocks. While US statistics indicate outflows from equity mutual funds and ETFs, there are indications that the money is not actually leaving the stock market. Instead it is being invested in the large companies that drive the performance of major capitalization-weighted indexes. It’s a sneaky form of indexing under the guise of “active management,” but a practice that props up both the major stock market indexes and the already-extended valuation of their major components.

We are not pessimists but we try to learn from experience

In spite of the cautionary tone of this first investment letter, we are neither timorous investors nor “perma-bears.” We actually keep a thick and growing file tracking all the reasons to be optimistic about the future. But in keeping with our commitment to think and invest as contrarian value investors, this file will only be opened when we sense that the investing crowd has become irrationally pessimistic. Today, we see it more as overly complacent. So, what to do?

Traditionally, value investors like us have tended to follow a “bottom-up” rather than a “top-down” approach. We don’t focus on analyzing the macroeconomic outlook or devising stock market strategies. Rather we concentrate on valuing individual companies and comparing our estimations to these companies’ stock prices. In the past, both logic and experience have vindicated that approach: It was fine to remain fully invested at all times because value stocks, often underpriced to start with, generally withstood price corrections better than the overall market.

But the recent 2007-9 financial crisis and recession demonstrated how global economies and financial markets are now so intertwined that a single event like the collapse of Lehman Brothers in 2008 can threaten the worldwide economic and financial order. This deflationary tornado changed many value investors’ views (including ours) on the subject of bottom-up vs. top-down investing, because all stocks — big and small, growth and value, financially strong and weak –were caught in the whirlpool.

The benefit of such traumatic events is that they create opportunities to invest at once-in-a-generation prices. The drawback is that their timing is almost impossible to predict. This is why we agree with Allianz’s chief economic adviser Mohamed El-Erian that, in today’s situation, keeping as much as 30% of your investment portfolio in cash is “not idiotic,” even though it will earn nothing or even less.9


References

  1. Michael Edesess in Advisor Perspectives,10/12/2015
  2. Howard Marks, Oaktree Capital Management – Business Insider, Jul 28, 2016
  3. Project Syndicate – 8/8/2016
  4. Forbes – Jul 18, 2012
  5. James Grant – The Enterprising Investor – 8/8/2016
  6. Business Insider January 25, 2016
  7. Seth Klarman – The Baupost Group 2015 year-end letter
  8. Forbes, 2/24/2016
  9. Business Insider – 3/15/2016

Disclosure: This report is not intended to be a client‐specific suitability analysis or recommendation, an offer to participate in any investment, or a recommendation to buy, hold or sell securities. Do not use this report as the sole basis for investment decisions. Do not select an asset class or investment product based on performance alone. Consider all relevant information, including your existing portfolio, investment objectives, risk tolerance, liquidity needs and investment time horizon. This report is for general informational purposes only and is not intended to predict or guarantee the future performance of any individual security, market sector or the markets generally.