Almost two years ago, I sent a memo to my clients entitled: “What does it mean to be rich anymore?” (Sicart Associates. 6/25/2022) I opened the discussion in this fashion:
For the past two decades, I have belonged to the ranks of the 1 percent — presumably the richest people in America. In truth, I never felt that rich and it brought me no particular pride — perhaps, instead, a touch of guilt thinking about the other 99 percent. Things have changed in the last twenty years or so, however, with the arrival of newer “ultra-rich” (the 0.1 percent).
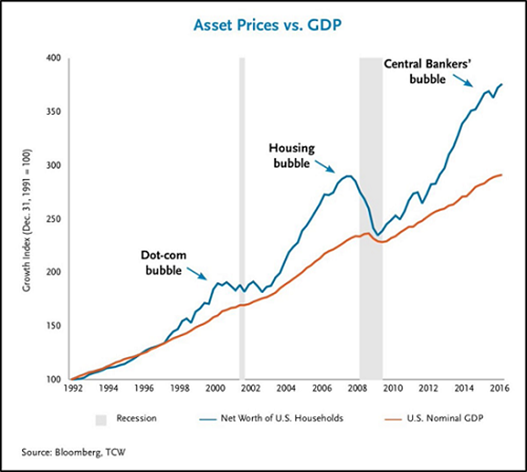
In the memo, I continued by wondering how individuals who would have considered themselves rich only a few years earlier now felt about being relegated to the middle class. The essential point, however, is that these people did not actually become poorer. Like me and like my clients, they constitute a class which owns assets such as stocks and homes. These assets have generally kept pace with and usually exceeded the rate of inflation. In other words, we have not suffered from the economic ups and downs of recent years.
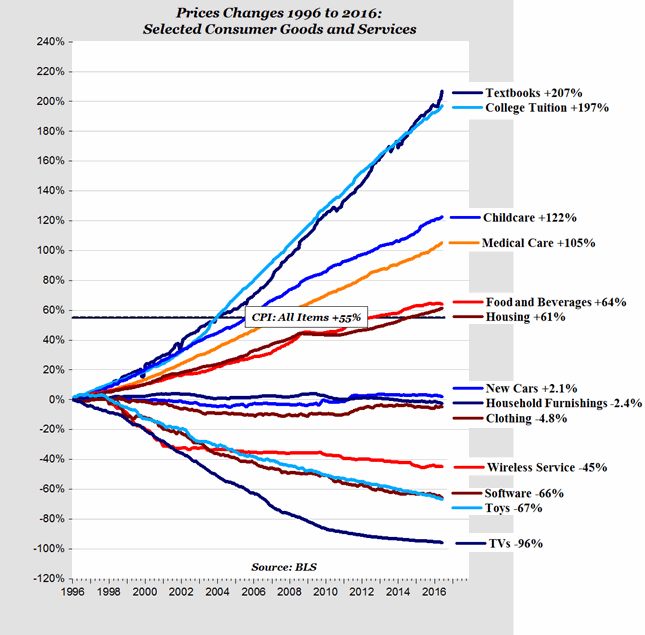
Yet in the last several years, a significant gap has opened between the fate of the asset-rich class and the large population that must survive on salaries or fixed incomes which have barely increased. Yet in the same period, the cost of living has exploded. Even people (especially young ones) who used to consider themselves “comfortable” now have a tough time finding housing and enjoying free time in large cities.
Still, the gap has become increasingly visible with the arrival of the 0.1 percent and their highly publicized but unattainable lifestyles, complete with huge mansions, yachts etc. This condition prevails not only in the United States, but also in many prosperous countries around the world. Not surprisingly, the result is increasingly severe social tensions between the proverbial “haves” and “have nots.” Just one example is the “yellow jackets” movement in France. Others are visible in the political gains of far-right parties in various countries.
LIVING WITH UNCERTAINTY
One of the most thoughtful pieces of investment advice I have ever read came from Howard Marks, one of the founders of Oaktree Capital Management. In one of his popular memos to clients he pointed out that “You can’t predict, you can prepare” (11/20/2001). From experience, it is obvious to me that trying to forecast the future in an uncertain world is a futile attempt. But prepare for what?
The nature of auction markets like the stock market ensures that the most popular or most highly-respected investments become the most expensive. Thus, it is most profitable to invest in scenarios that are opposite to or at least different from the consensus – provided that thoughtful analysis shows them to be at least credible.
Central banks are not all-powerful
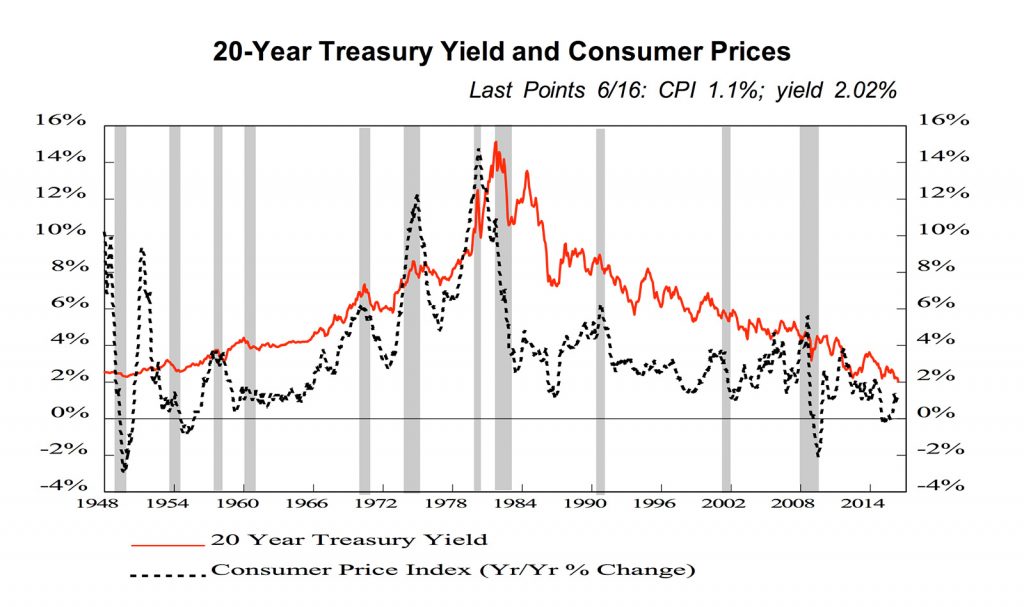
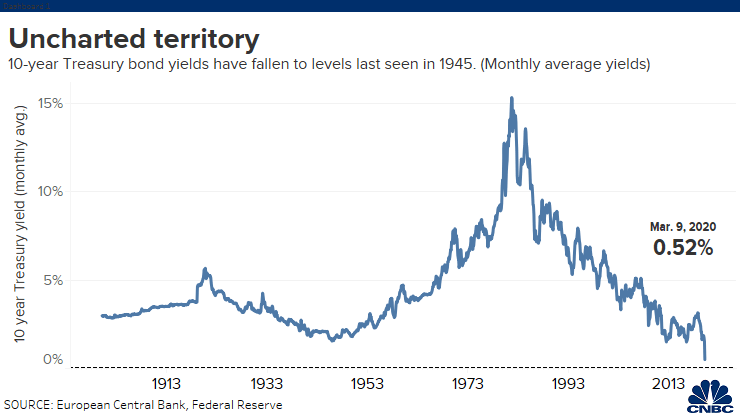
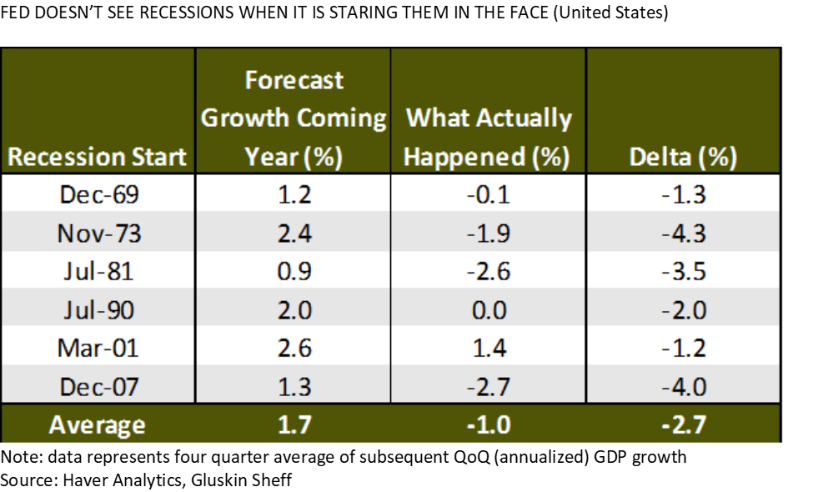
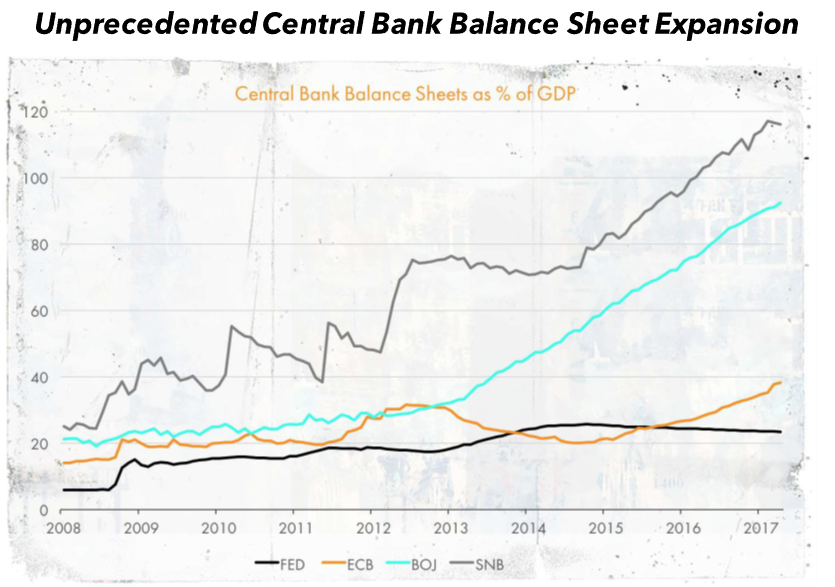
Currently, one consensus among economists is that central banks, and particularly the US Federal Reserve, are all-powerful. Hence, all eyes are fixed on how fast declining inflation will allow them to reduce interest rates to pre-COVID levels.
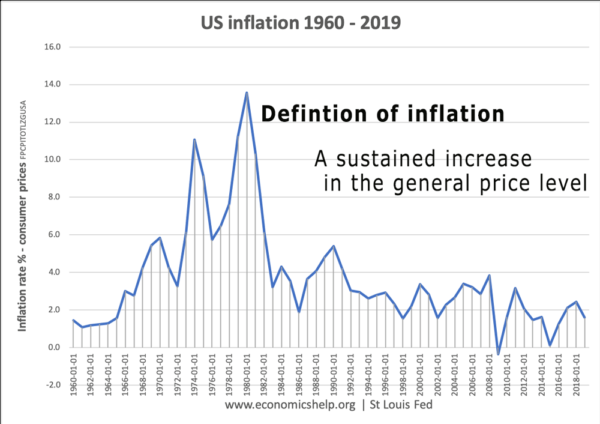
However, the various components of the economy do not respond uniformly to changes of interest rates. For example, since inflation is declining but remains historically high, lower rates are creating a euphoric bull market in stocks. Meanwhile the budgets of lower-income consumers are still constrained by stubbornly high prices for basic goods.
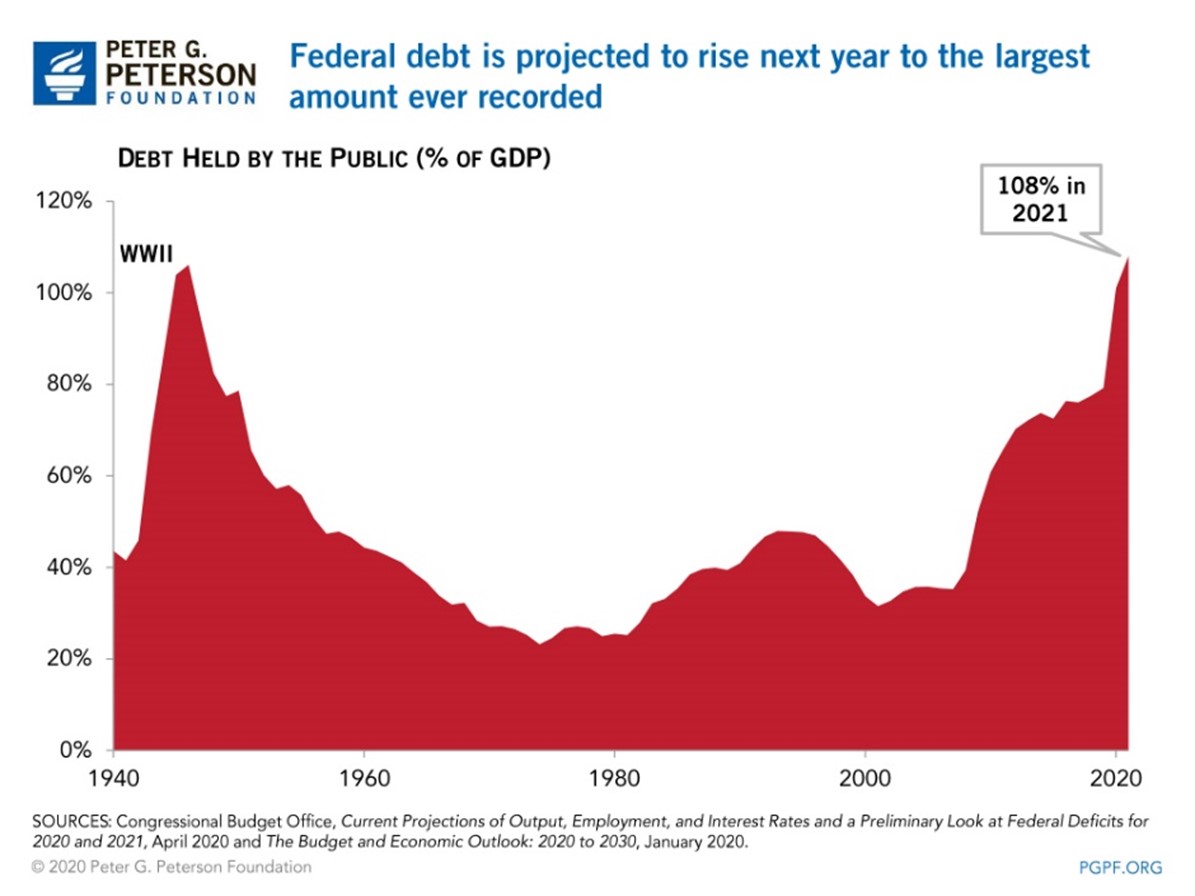
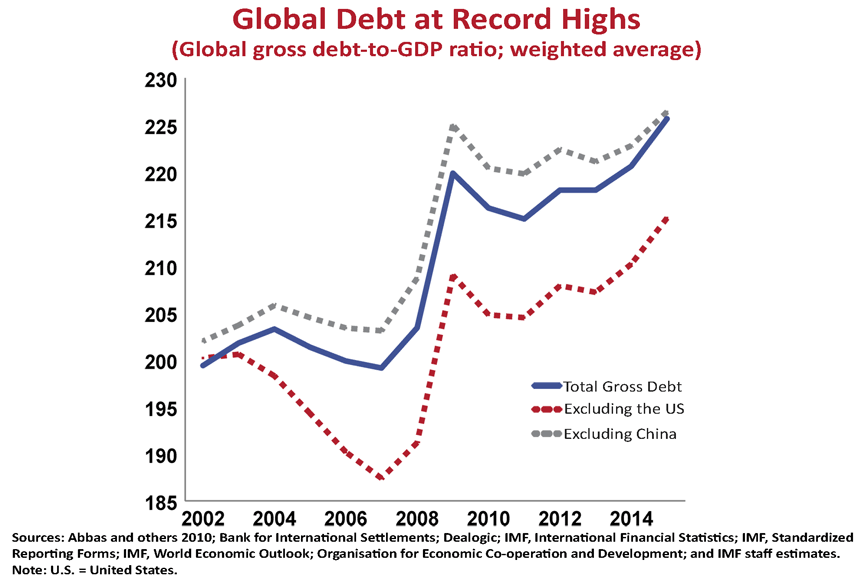
Generally, central bank policies may be a good macro-economic tool, but they are not a very discerning one when various parts of the economy are at different stages of their cycles. Better tools are budgetary ones but after the pandemic, the problems in Ukraine, the war in the Middle East, and the ongoing tensions with China, budgets are stretched while the debt of many nations imposes limits on government spending.
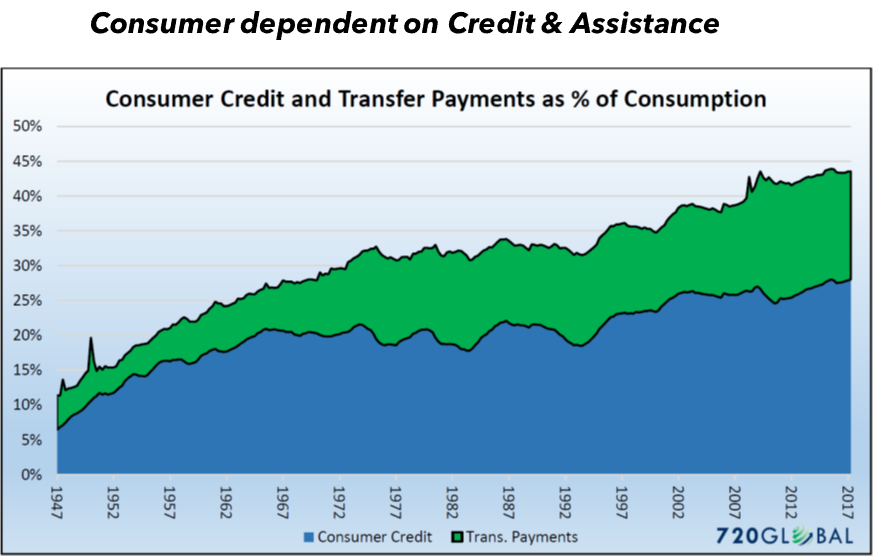
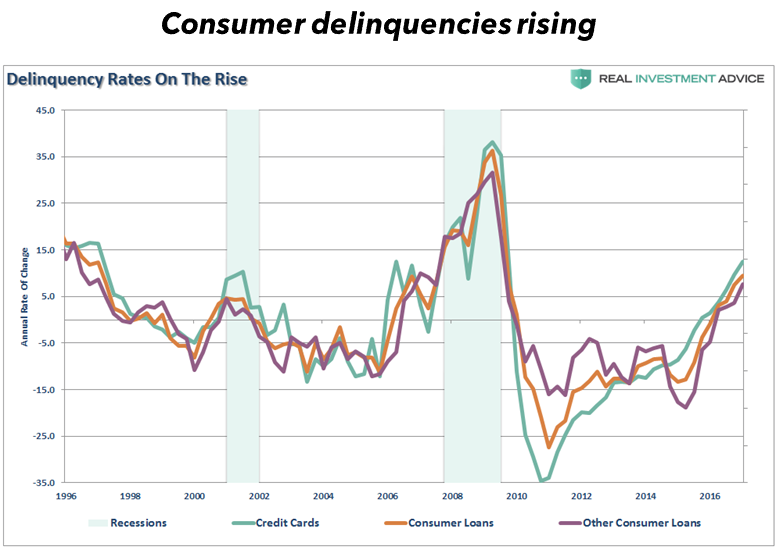
In addition to these pressures in the United States, federal assistance — which had temporarily boosted some lower household incomes — has been evaporating. Less-wealthy households have resorted to borrowing to maintain their levels of spending, thus producing higher levels of credit card and other consumer debt. This phenomenon threatens overall consumer spending. I, for one, have not ruled out the possibility of some version of recession, possibly triggered by diminished liquidity created by the Fed, banks, and other factors such as less-regulated private credit.
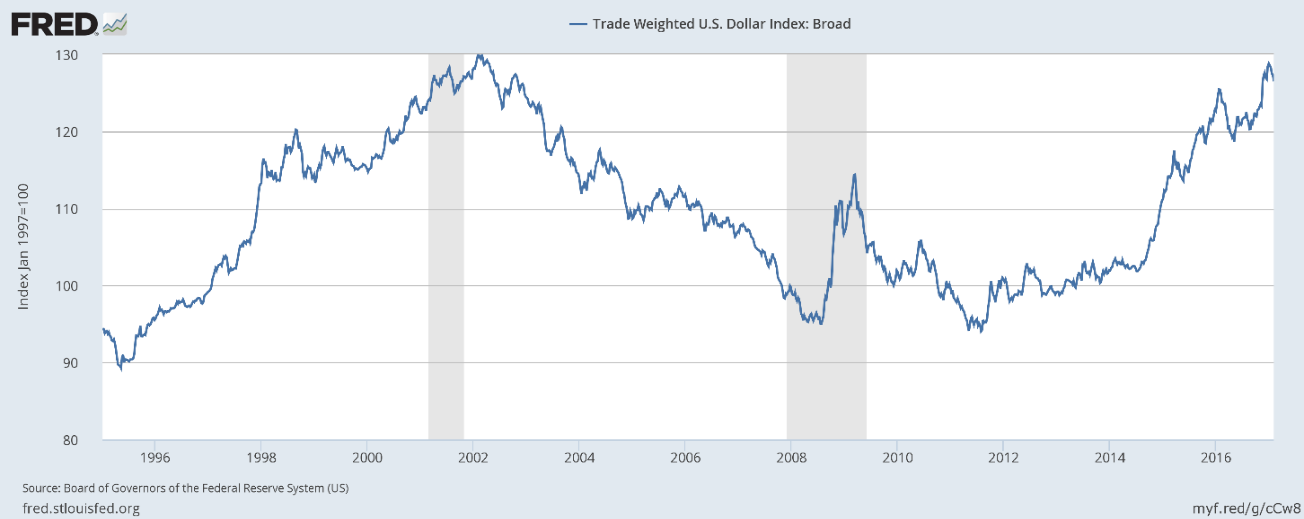
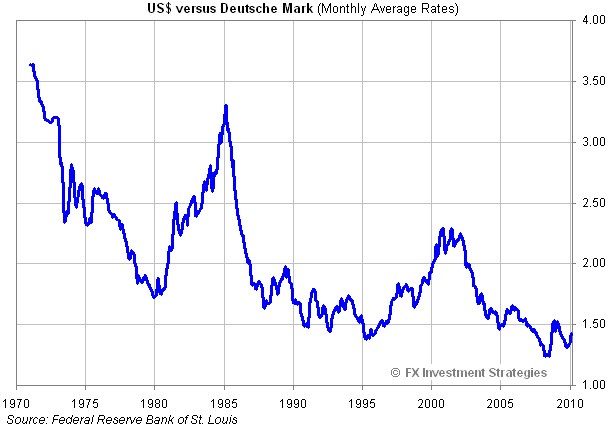
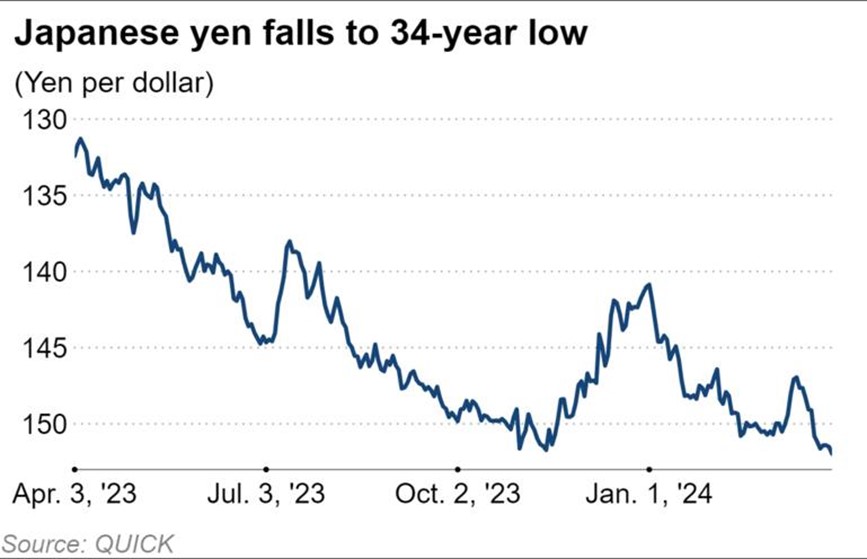
The dollar’s strength is a problem for many countries
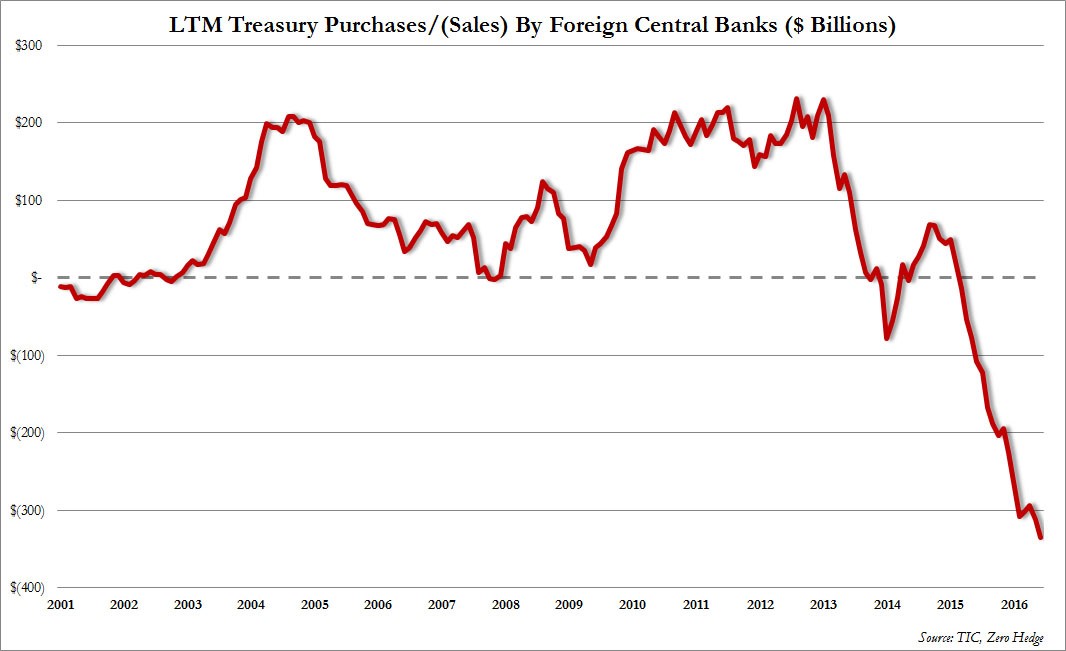
There has been recurring speculation about which currency might replace the US dollar as the world’s leading trade and liquidity instrument. A number of potential contenders exist but few seem yet capable of offering the combination of size, freedom of movement, and willingness to accept the responsibilities attendant on the role of world currency.
I have observed a number of bi-lateral or regional trade and currency arrangements that have cropped up in recent years to reduce the dependence on the dollar. Nevertheless, the continued appeal of US currency still attracts capital.
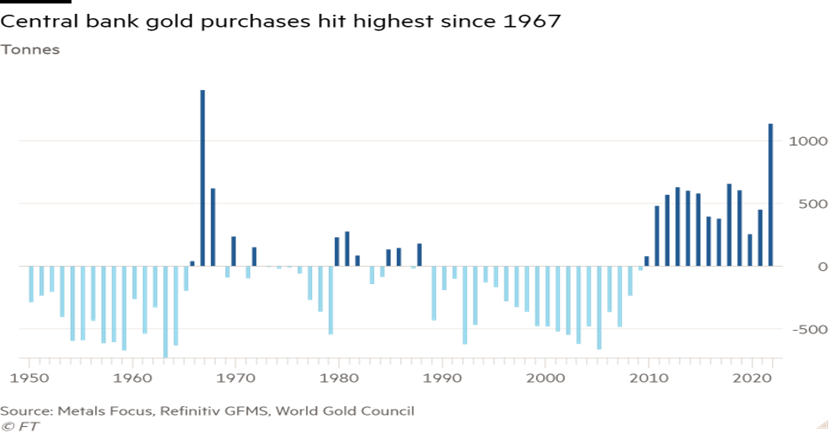
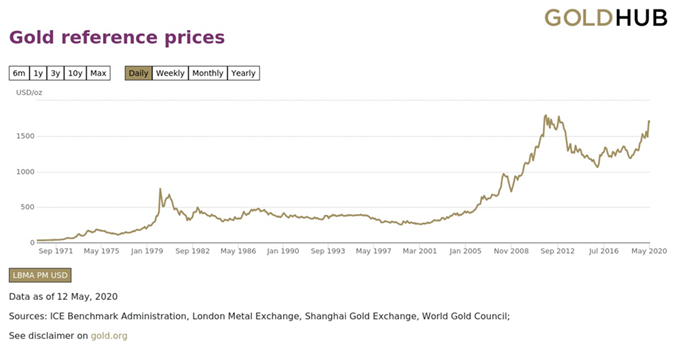
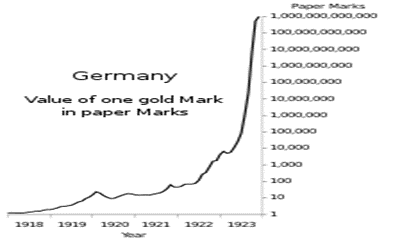
My rationale for almost always retaining a gold position in our portfolios is to insure against many unforeseen events; to protect against inflation, visible in the erosion in the purchasing power of money; and to provide a safeguard against deflation as it often prompts in the destruction of some currencies through financial crises and other failures.
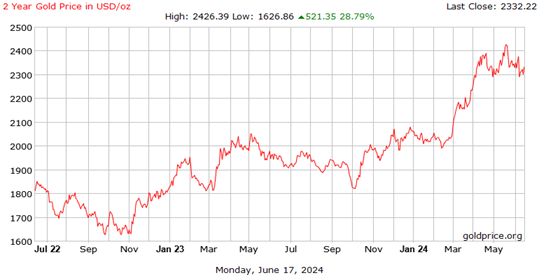
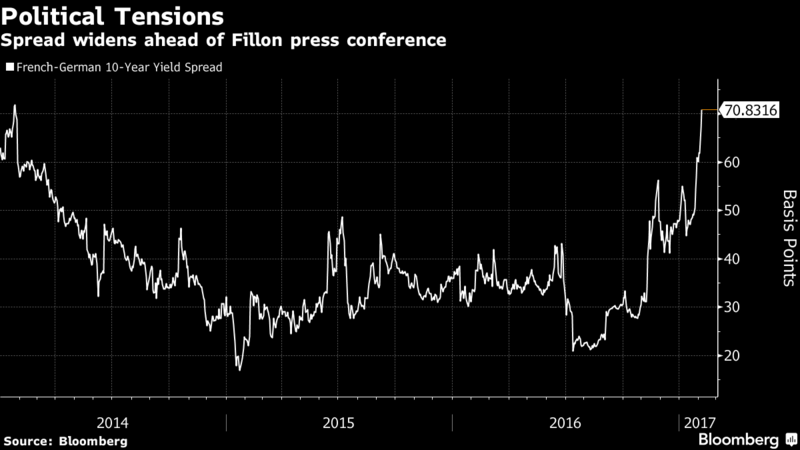
Geopolitical tensions and potential shocks are all too visible on our horizon these days, as are possible financial adverse events, especially if currencies remain highly volatile.
More generally, I tend to think that when investors misbehave — for instance by speculating or by taking on unwarranted debt — a day of reckoning must eventually come. Since I cannot be sure what this day of reckoning will look like, gold seems a good way to prepare!
François Sicart 06/20/2024
The information provided in this article represents the opinions of Sicart Associates, LLC (“Sicart”) and is expressed as of the date hereof and is subject to change. Sicart assumes no obligation to update or otherwise revise our opinions or this article. The observations and views expressed herein may be changed by Sicart at any time without notice.
This article is not intended to be a client‐specific suitability analysis or recommendation, an offer to participate in any investment, or a recommendation to buy, hold or sell securities. Do not use this report as the sole basis for investment decisions. Do not select an asset class or investment product based on performance alone. Consider all relevant information, including your existing portfolio, investment objectives, risk tolerance, liquidity needs and investment time horizon. This article is for general informational purposes only and is not intended to predict or guarantee the future performance of any individual security, market sector or the markets generally.
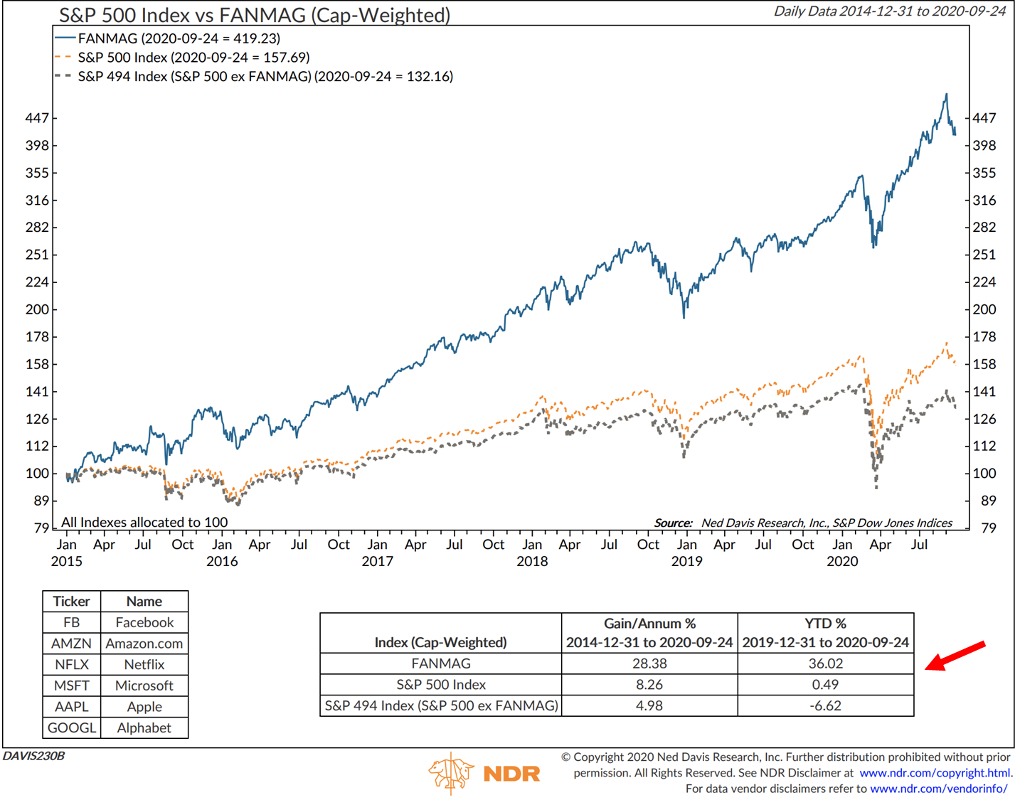

 NYSE “FANG+” INDEX *
 S&P 500 INDEX **

 “It’s in The Price!”